
Deploying an application to production is only the beginning. You need to know whether your application is healthy and whether your database, cache, and message queue are reachable.
Without proper monitoring, you will only find out about issues when your users start complaining.
I have spent years building and maintaining high-load .NET systems, and health checks have always been my first line of defense. Today, I want to show you how to set up a production-ready monitoring system that gives you complete visibility into your application's health.
In this post, we will explore:
- Why health checks matter for production applications
- Adding health checks for Postgres, Redis, MongoDB, and RabbitMQ
- Building custom health checkers
- Building a custom JSON response formatter
- Implementing a custom health check publisher
- Setting up a professional Health Checks UI
Let's dive in.
Why Health Checks Matter
When you run an application in a modern environment like Kubernetes or Azure, the platform needs to know if your app is ready to handle traffic. This is where health checks come in.
A health check is a simple endpoint that returns the status of your application. If the database or message queue is down, the health check should report that the service is "Unhealthy".
Without health checks:
- Load balancers might send traffic to a broken instance.
- You won't know about database connection issues until users report errors.
- Background tasks might stop running without anyone noticing.
ASP.NET Core provides a built-in framework for health checks. It allows you to check everything from database connections to external APIs and system resources.
Adding Health Checks to Your Services
To add health checks to your services, you need to install the following NuGet package:
bashdotnet add package Microsoft.Extensions.Diagnostics.HealthChecks
Then you need to install the appropriate health-check packages for the external services you use.
I have built two services: ShippingService and OrderTrackingService.
Each has different dependencies.
ShippingService (Postgres and EF Core)
The ShippingService uses PostgreSQL and Entity Framework Core.
We want to make sure the database is alive and that our DbContext is correctly configured.
You need to install the following NuGet packages:
bashdotnet add package AspNetCore.HealthChecks.NpgSql dotnet add package Microsoft.Extensions.Diagnostics.HealthChecks.EntityFrameworkCore
In the HealthExtensions.cs file, we register our health checks:
csharppublic static IServiceCollection AddHealth(this IServiceCollection services, IConfiguration configuration) { var postgresConnectionString = configuration.GetConnectionString("Postgres")!; services.AddHealthChecks() .AddDbContextCheck<ShippingDbContext>( name: "database", failureStatus: HealthStatus.Unhealthy, tags: ["database"]) .AddNpgSql( connectionString: postgresConnectionString, name: "postgres", failureStatus: HealthStatus.Unhealthy, tags: ["database"]); return services; }
- AddNpgSql: This check connects directly to the database using the connection string. It verifies that the PostgreSQL server is live and accepting connections.
- AddDbContextCheck: This check verifies that the Entity Framework Core
DbContextcan be created and can talk to the database. The database can be live, but your EF Core configuration can be broken. This check catches that.
To make your /health endpoint accessible, you need to map it in Program.cs:
csharpapp.MapHealthChecks("/health");
You can customize the health check for DbContext by providing a custom test query.
In this test query, you can access any entity and perform any operation:
csharppublic static IServiceCollection AddHealth(this IServiceCollection services, IConfiguration configuration) { var postgresConnectionString = configuration.GetConnectionString("Postgres")!; services.AddHealthChecks() .AddDbContextCheck<ShippingDbContext>("Shipping database", customTestQuery: CustomTestQueryAsync<ShippingDbContext, Shipment>) .AddNpgSql( connectionString: postgresConnectionString, name: "postgres", failureStatus: HealthStatus.Unhealthy, tags: ["database"]); return services; } private static async Task<bool> CustomTestQueryAsync<TDbContext, TEntity>( TDbContext dbContext, CancellationToken token) where TDbContext : DbContext where TEntity : class { var count = await dbContext.Set<TEntity>().CountAsync(token); return count > 0; }
OrderTrackingService (MongoDB and Redis)
The OrderTrackingService uses MongoDB and Redis.
You need to install the following NuGet packages:
bashdotnet add package AspNetCore.HealthChecks.MongoDb dotnet add package AspNetCore.HealthChecks.Redis
This is how you can configure health checks for MongoDB and Redis:
csharppublic static IServiceCollection AddHealth(this IServiceCollection services, IConfiguration configuration) { var mongoDbConnectionString = configuration.GetConnectionString("MongoDb")!; var redisConnectionString = configuration.GetConnectionString("Redis")!; services.AddHealthChecks() .AddMongoDb( mongoDbConnectionString, name: "mongodb", failureStatus: HealthStatus.Unhealthy, tags: ["database"]) .AddRedis( name: "redis", redisConnectionString: redisConnectionString); return services; }
RabbitMQ Health Checks
Both our services talk to each other via events over a message queue (RabbitMQ). We want to make sure the message queue is alive and that our consumers are running correctly.
The first option is to install the following NuGet package:
bashdotnet add package AspNetCore.HealthChecks.Rabbitmq
Or, if you use MassTransit in your project, it automatically registers its own health checks into the ASP.NET Core health check system. You don't need to add anything manually. MassTransit will report whether the message bus (e.g., RabbitMQ) is healthy and whether the consumers are running correctly.
It is registered automatically when you register MassTransit in your DI container.
csharpprivate static IServiceCollection AddMessageQueue(this IServiceCollection services, IConfiguration configuration) { var rabbitMqConfiguration = configuration .GetSection(nameof(RabbitMQConfiguration)) .Get<RabbitMQConfiguration>()!; services.AddMassTransit(busConfig => { busConfig.SetKebabCaseEndpointNameFormatter(); busConfig.UsingRabbitMq((context, cfg) => { cfg.Host(new Uri(rabbitMqConfiguration.Host), h => { h.Username(rabbitMqConfiguration.Username); h.Password(rabbitMqConfiguration.Password); }); cfg.ConfigureEndpoints(context); }); }); return services; }
Building a Custom Health Checker
When adding health checks to your project, I recommend starting by looking for a ready-made NuGet package. If you can't find one, you can create a custom health checker.
For example, you should track the free disk space on your server. System resources are just as important as external services. If your server runs out of disk space, your application will crash.
We can create a custom health checker by implementing the IHealthCheck interface.
Here is a DiskSpaceHealthCheck that monitors free space on a drive:
csharppublic sealed class DiskSpaceHealthCheck : IHealthCheck { private readonly string _path; private readonly long _minFreeBytes; public DiskSpaceHealthCheck(string path, long minFreeBytes) { _path = path; _minFreeBytes = minFreeBytes; } public Task<HealthCheckResult> CheckHealthAsync( HealthCheckContext context, CancellationToken cancellationToken = default) { var drive = new DriveInfo(_path); if (!drive.IsReady) { return Task.FromResult(HealthCheckResult.Unhealthy("Disk is not ready.")); } var free = drive.AvailableFreeSpace; if (free < _minFreeBytes) { return Task.FromResult( HealthCheckResult.Degraded($"Low disk space. Free bytes: {free}.")); } return Task.FromResult( HealthCheckResult.Healthy($"Disk space OK. Free bytes: {free}.")); } }
Then we register it in our AddHealth method:
csharpservices.AddHealthChecks() .AddCheck(name: "disk-space", instance: new DiskSpaceHealthCheck(path: "C:/", minFreeBytes: 500_000_000));
Custom JSON Response Formatter
By default, the /health endpoint returns a simple "Healthy" or "Unhealthy" string.
In a production environment, you need more details. You want to see which specific check failed and why.
We can create a HealthCheckJsonResponseWriter to return a structured JSON response:
csharppublic static class HealthCheckJsonResponseWriter { private static readonly JsonSerializerOptions JsonSerializerOptions = new JsonSerializerOptions { WriteIndented = false, PropertyNamingPolicy = JsonNamingPolicy.CamelCase, DefaultIgnoreCondition = JsonIgnoreCondition.WhenWritingNull }; public static Task WriteResponse(HttpContext context, HealthReport report) { var json = JsonSerializer.Serialize( new { Status = report.Status.ToString(), Duration = report.TotalDuration, Info = report.Entries .Select(e => new { Key = e.Key, Description = e.Value.Description, Duration = e.Value.Duration, Status = Enum.GetName(e.Value.Status), Error = e.Value.Exception?.Message, Data = e.Value.Data, Tags = e.Value.Tags }) .ToList() }, JsonSerializerOptions); context.Response.ContentType = MediaTypeNames.Application.Json; return context.Response.WriteAsync(json); } }
Now, when you map your health checks in Program.cs, you use this writer:
csharpapp.MapHealthChecks("/health", new HealthCheckOptions { Predicate = _ => true, ResponseWriter = HealthCheckJsonResponseWriter.WriteResponse });
Let's run our service and test our health endpoints:
ShippingService:
json{ "status": "Healthy", "totalDuration": "00:00:00.0415370", "entries": { "masstransit-bus": { "data": { "Endpoints": { "rabbitmq://127.0.0.1/PC_ShippingService_bus?temporary=true": { "status": "Healthy", "description": "ready (not started)" } } }, "description": "Ready", "duration": "00:00:00.0000459", "status": "Healthy", "tags": [ "ready", "masstransit" ] }, "database": { "data": { }, "duration": "00:00:00.0413031", "status": "Healthy", "tags": [ "database" ] }, "postgres": { "data": { }, "duration": "00:00:00.0011592", "status": "Healthy", "tags": [ "database" ] }, "disk-space": { "data": { }, "description": "Disk space OK. Free bytes: 179225227264.", "duration": "00:00:00.0001174", "status": "Healthy", "tags": [] } } }
OrderTrackingService:
json{ "status": "Healthy", "totalDuration": "00:00:00.0019189", "entries": { "masstransit-bus": { "data": { "Endpoints": { "rabbitmq://127.0.0.1/shipment-created-order-tracking-service": { "status": "Healthy", "description": "ready" }, "rabbitmq://127.0.0.1/shipment-status-updated-order-tracking-service": { "status": "Healthy", "description": "ready" }, "rabbitmq://127.0.0.1/PC_OrderTrackingService_bus?temporary=true": { "status": "Healthy", "description": "ready (not started)" } } }, "description": "Ready", "duration": "00:00:00.0000527", "status": "Healthy", "tags": [ "ready", "masstransit" ] }, "mongodb": { "data": { }, "duration": "00:00:00.0011671", "status": "Healthy", "tags": [ "database" ] }, "redis": { "data": { }, "duration": "00:00:00.0018187", "status": "Healthy", "tags": [] } } }
Implementing a Custom Health Check Publisher
If your application becomes unhealthy, you want to know about it immediately. While you can monitor the endpoint, it can be useful to check your health status in your application itself.
We can implement IHealthCheckPublisher.
This publisher runs in the background at regular intervals.
This is a simple implementation that logs changes in health reports:
csharppublic class MonitoringHealthCheckPublisher( ILogger<MonitoringHealthCheckPublisher> logger) : IHealthCheckPublisher { private readonly JsonSerializerOptions _jsonSerializerOptions = new() { WriteIndented = true, Encoder = JavaScriptEncoder.UnsafeRelaxedJsonEscaping, DefaultIgnoreCondition = JsonIgnoreCondition.WhenWritingNull, Converters = { new JsonStringEnumConverter() } }; private HealthReport? _lastReport; public Task PublishAsync(HealthReport report, CancellationToken cancellationToken) { // Log only changes in health reports if (_lastReport is null || !HealthReportsAreEqual(report, _lastReport)) { logger.LogInformation("Health report has changed. Status: {Status}, Duration: {Duration}, Report: {Report}", report.Status, report.TotalDuration, JsonSerializer.Serialize(report, _jsonSerializerOptions)); } _lastReport = report; return Task.CompletedTask; } }
Register the publisher and configure how often it should run:
csharpservices.AddSingleton<IHealthCheckPublisher, MonitoringHealthCheckPublisher>(); services.Configure<HealthCheckPublisherOptions>(options => { options.Period = TimeSpan.FromSeconds(60); });
You can also inject the HealthCheckService into any of your classes and check the Health status on demand:
csharppublic async Task<HealthStatus> GetCurrentHealthStatusAsync() { var report = await _healthCheckService.CheckHealthAsync(CancellationToken.None); if (report.Status == HealthStatus.Unhealthy) { logger.LogInformation("Application is unhealthy!"); foreach (var entry in report.Entries) { logger.LogInformation("Entry is unhealthy: {@Entry}", entry); } } return report.Status; }
Setting Up Health Checks UI
Visualizing health checks makes it much easier to monitor your system.
The AspNetCore.HealthChecks.UI package provides a web dashboard that aggregates health data from all your services.
You can explore the Health Checks UI GitHub repository for more information.
First, add the following NuGet packages:
bashdotnet add package AspNetCore.HealthChecks.UI dotnet add package AspNetCore.HealthChecks.UI.Client dotnet add package AspNetCore.HealthChecks.UI.InMemory.Storage
Then, register the UI services:
csharpservices .AddHealthChecksUI(options => { options.AddHealthCheckEndpoint("Shipping Service API", "/health"); }) .AddInMemoryStorage();
Here, we use an in-memory storage provider for storing health reports while the application is running.
In production, depending on your needs, you may need to persist these results into the database. Explore more persistence options for your Health Checks UI in the GitHub repository.
Then, map the UI endpoints in Program.cs:
csharpapp.MapHealthChecks("/health", new HealthCheckOptions { Predicate = _ => true, ResponseWriter = UIResponseWriter.WriteHealthCheckUIResponse }); app.MapHealthChecksUI(options => { options.UIPath = "/health-ui"; options.ApiPath = "/health-ui-api"; });
Note: for health-ui to be able to parse the health check responses, you need to use the UIResponseWriter.WriteHealthCheckUIResponse type.
This type comes from the AspNetCore.HealthChecks.UI.Client NuGet package.
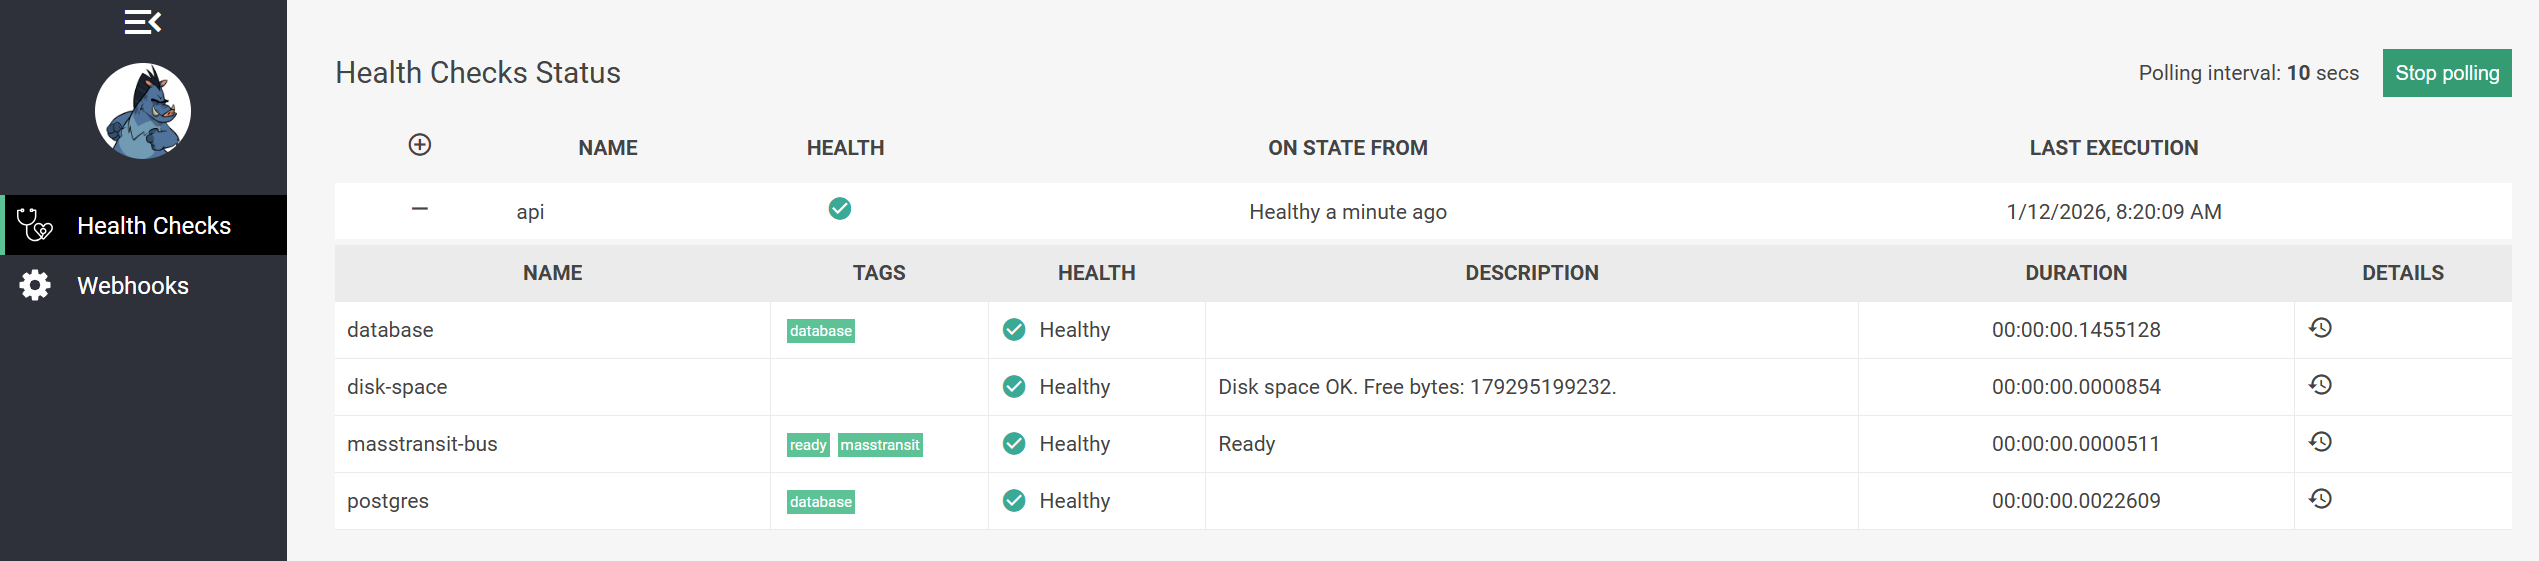
Now you can visit /health-ui to see a professional dashboard showing the health of all your services and their dependencies:
Shippingservice:
OrderTrackingService:
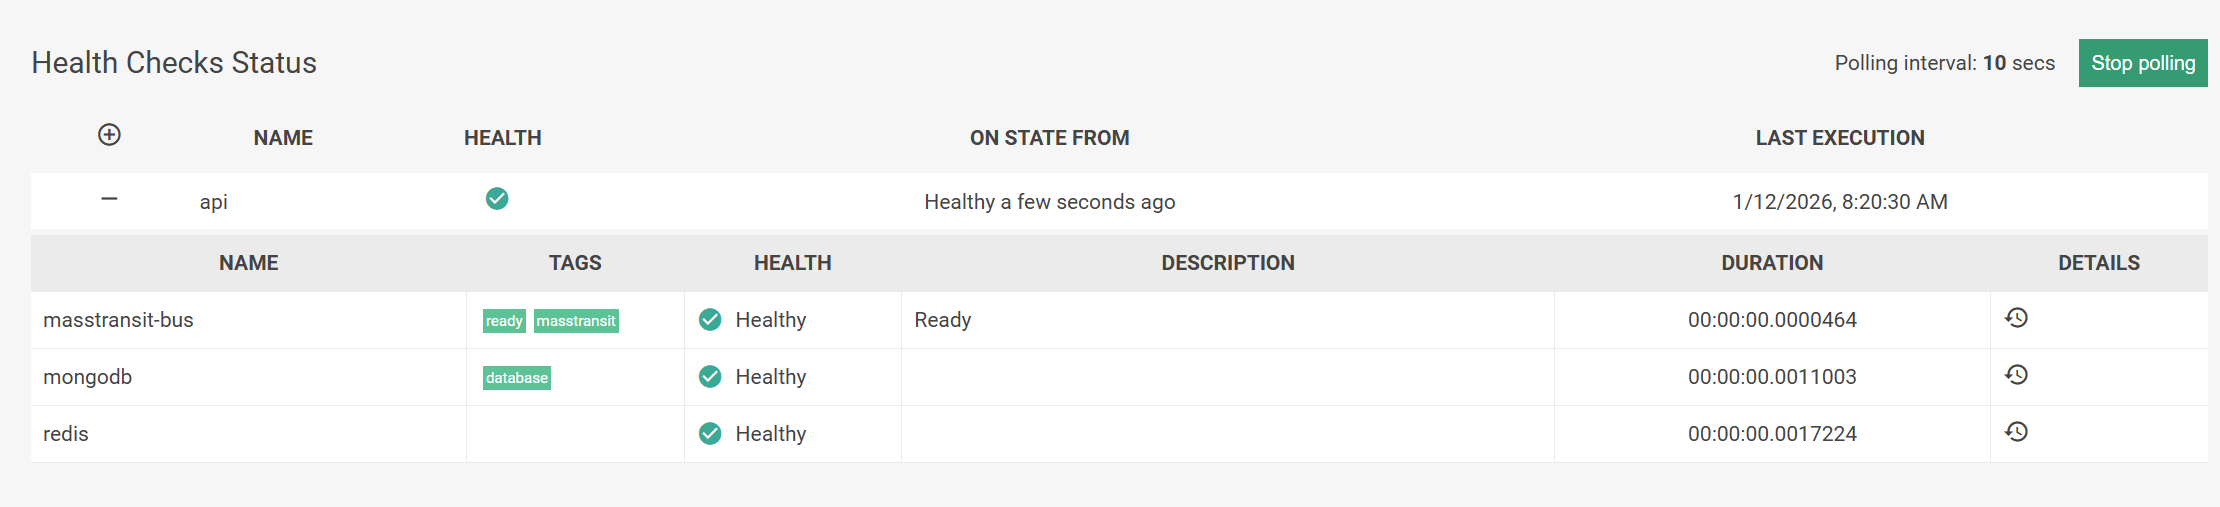
Important note:
In production you should not make Health endpoint and UI visible in public.
You need to secure access to these endpoints with authentication and authorization.
You can configure this with a RequireAuthorization method:
csharpapp.MapHealthChecks("/health", new HealthCheckOptions { Predicate = _ => true, ResponseWriter = UIResponseWriter.WriteHealthCheckUIResponse }).RequireAuthorization(RoleConsts.RoleAdmin);
You can find more information about authorization for the UI in the GitHub repository.
Summary
Setting up health checks is one of the most important things you can do for your production application. It provides visibility and enables your infrastructure to automatically respond to failures.
If you want to increase your application's visibility, I recommend adding OpenTelemetry.
Health checks show what components of your application are working correctly. OpenTelemetry, on the other hand, provides a complete view of your application's performance, your request flows and what data is being processed.
To get started with OpenTelemetry, you can follow my article.
Hope you find this newsletter useful. See you next time.
Comments