
In today's complex software environments, understanding what's happening in your applications is no longer optional - it's essential. Bugs like to hide in the dark, and they will appear when you least expect them.
OpenTelemetry opens the light into what is happening in your application. It provides a standardized way to collect and analyze telemetry data from your applications, giving you visibility into their behavior.
OpenTelemetry is essential for monitoring any application, from large microservices to monoliths. Yes, even in monoliths you can benefit from OpenTelemetry.
Every application has external dependencies, like databases, cache, APIs, and external services. Monitoring these dependencies is essential for understanding how your application is performing and interacting with the rest of the system.
Today I will show you how to implement OpenTelemetry to gain valuable insights into your system's performance and health.
You will learn:
- What is OpenTelemetry and why do you need it
- Logs, metrics and traces
- How to add OpenTelemetry to your project
- How to view OpenTelemetry data in Jaeger
- How to view OpenTelemetry data in Seq
- Adding custom instrumentation and properties to OpenTelemetry
Let's get started!
What is OpenTelemetry and Why You Need It
OpenTelemetry is an open-source observability framework that provides APIs, libraries, and tools to instrument, generate, collect, and export telemetry data for analysis.
OpenTelemetry collects logs, metrics, and traces from your applications and infrastructure:
- Logs - explain what
- Traces - reveal where and how long
- Metrics - show how often
OpenTelemetry key characteristics:
- Vendor-neutral: supports a wide range of languages and frameworks, including .NET, Java, Go, Python, JavaScript, and more.
- Easy to use: with a simple API and SDK, easy to integrate into your existing applications.
- Portable: making it easy to move your data to a new monitoring system.
- Lightweight: with minimal CPU and allocation impact.
- Extensible: making it easy to add new instrumentation and exporters.
OpenTelemetry has the following benefits:
For Monoliths:
- Internal Performance Insights: Understand which components of your monolith are causing slowdowns.
- Database Interactions: Monitor database query performance and connection issues.
- External Service Dependencies: Track calls to external APIs and services.
- Future-Proofing: If you ever decide to break your monolith into microservices, you'll already have observability infrastructure in place.
For Microservices:
- End-to-End Request Tracing: Follow requests as they travel through multiple services.
- Service Dependency Maps: Visualize how your services interact and depend on each other.
- Distributed Problem Solving: Quickly identify which service is causing an issue in a complex system.
Logs
Logs are timestamped records of discrete events that happen in your application. They provide context about what happened at a specific point in time:
2025-07-30 14:23:45.123 INFO OrderService Order #12345 created for customer #789 2025-07-30 14:23:44.390 INFO OrderService Order #12345 processed for customer #789
Logs are essential for analysis and understanding what happened in your system at a specific time.
Traces
Traces track the progression of a request as it travels through different parts of your application or across multiple services in a distributed system.
A trace typically starts when a request enters your system and ends when the response is returned. Each trace consists of one or more spans, with each span representing a specific operation (like a database query, API call, or computation).
Traces are invaluable for understanding request flows and identifying performance bottlenecks.
Metrics
Metrics are numerical measurements collected over time. They provide aggregated data about system behavior and performance.
Common Types of Metrics:
- Counters: Values that only increase (e.g., total requests processed)
- Gauges: Values that can go up and down (e.g., active connections)
- Histograms: Distribution of values (e.g., request duration percentiles)
- Summaries: Similar to histograms but calculated client-side
Metrics are essential for understanding trends, setting up alerts, and creating dashboards.
Now let's explore how to add OpenTelemetry to your project.
How to Add OpenTelemetry to Your Project
Today we will explore how to add OpenTelemetry for two microservices talking to each other: ShippingService and OrderTrackingService.
ShippingService is responsible for creating and updating shipments for purchased products.
OrderTrackingService is responsible for tracking shipment status and notifying users of shipment updates via email.
These services use the following instrumentation that we can observe with OpenTelemetry:
- ASP.NET Core Web API
- PostgreSQL (ShippingService)
- MongoDB (OrderTrackingService)
- HttpClient calls (Refit)
- Redis (for caching)
- MailKit (for sending emails)
To instrument your microservices with OpenTelemetry for tracing, follow these steps:
- Add the OpenTelemetry packages to each microservice project.
- Configure the OpenTelemetry tracer to generate and propagate traces.
- Set up the necessary trace context propagation.
First, we need to add the following Nuget Packages:
bashdotnet add package MongoDB.Driver.Core.Extensions.DiagnosticSources dotnet add package Npgsql.OpenTelemetry dotnet add package OpenTelemetry.Exporter.OpenTelemetryProtocol dotnet add package OpenTelemetry.Extensions.Hosting dotnet add package OpenTelemetry.Instrumentation.AspNetCore dotnet add package OpenTelemetry.Instrumentation.Http dotnet add package OpenTelemetry.Instrumentation.Runtime dotnet add package OpenTelemetry.Instrumentation.StackExchangeRedis
To configure tracing, you need to add OpenTelemetry into DI:
csharpservices .AddOpenTelemetry() .ConfigureResource(resource => resource.AddService("ShippingService")) .WithTracing(tracing => { tracing .AddAspNetCoreInstrumentation() .AddHttpClientInstrumentation() .AddNpgsql() .AddSource(MassTransit.Logging.DiagnosticHeaders.DefaultListenerName); tracing.AddOtlpExporter(); }); services .AddOpenTelemetry() .ConfigureResource(resource => resource.AddService("OrderTrackingService")) .WithTracing(tracing => { tracing .AddAspNetCoreInstrumentation() .AddHttpClientInstrumentation() .AddRedisInstrumentation() .AddSource(MassTransit.Logging.DiagnosticHeaders.DefaultListenerName) .AddSource("MongoDB.Driver.Core.Extensions.DiagnosticSources"); tracing.AddOtlpExporter(); });
You need to configure the resource by specifying the service name and adding appropriate trace instrumentations:
- AddAspNetCoreInstrumentation - adds asp.net core traces
- AddHttpClientInstrumentation - adds traces when you send a request using an HTTP client
- AddRedisInstrumentation - adds Redis traces
- AddNpgsql - adds PostgreSQL traces
- AddSource("MassTransit") - adds MassTransit and RabbitMQ traces
- AddSource("MongoDB") - adds MongoDB traces
You can send telemetry data to your backend systems by configuring exporters.
OpenTelemetry supports various export protocols:
- OTLP (OpenTelemetry Protocol): The native protocol for OpenTelemetry
- Jaeger: For compatibility with Jaeger tracing
- Seq: For compatibility with Seq tracing
- Zipkin: For compatibility with Zipkin tracing
- Prometheus: For exporting metrics to Prometheus
- Console: For debugging (outputs to console/stdout)
Let's explore how to visualize OpenTelemetry data in Jaeger.
How To View OpenTelemetry Data in Jaeger
Jaeger is one of the most popular open-source tools for distributed tracing and works well with OpenTelemetry.
The easiest way to run Jaeger is using Docker:
ymljaeger: image: jaegertracing/all-in-one:latest container_name: jaeger restart: always ports: - 4317:4317 - 4318:4318 - 16686:16686
Now we need to configure OpenTelemetry to send data to Jaeger.
You can do this in code using tracing.AddOtlpExporter(); method or set it in the appsettings.json.
I prefer the appsettings.json:
json{ "OTEL_EXPORTER_OTLP_ENDPOINT": "http://localhost:4318", "OTEL_EXPORTER_OTLP_PROTOCOL": "http/protobuf" }
This configures the gRPC endpoint to send data to Jaeger. Alternatively, you can use HTTP calls:
json{ "OTEL_EXPORTER_OTLP_ENDPOINT": "http://localhost:4317" }
Now let's start both services and send a few requests.
You can access the Jaeger UI at http://localhost:16686:
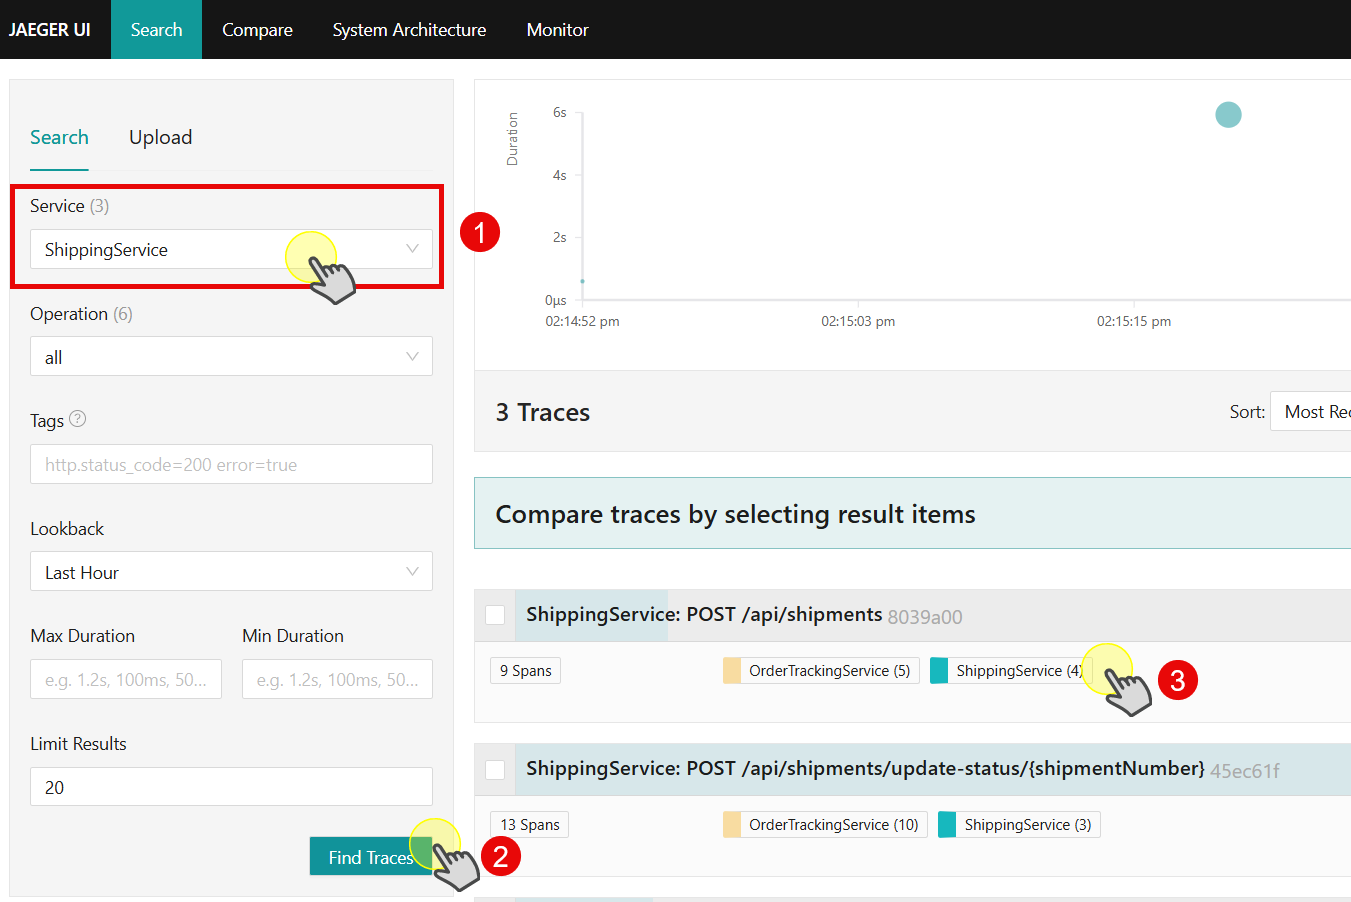
Select the service, click "Find Traces" and select the trace you want to examine.
Let's examine the "Create Shipment" request:
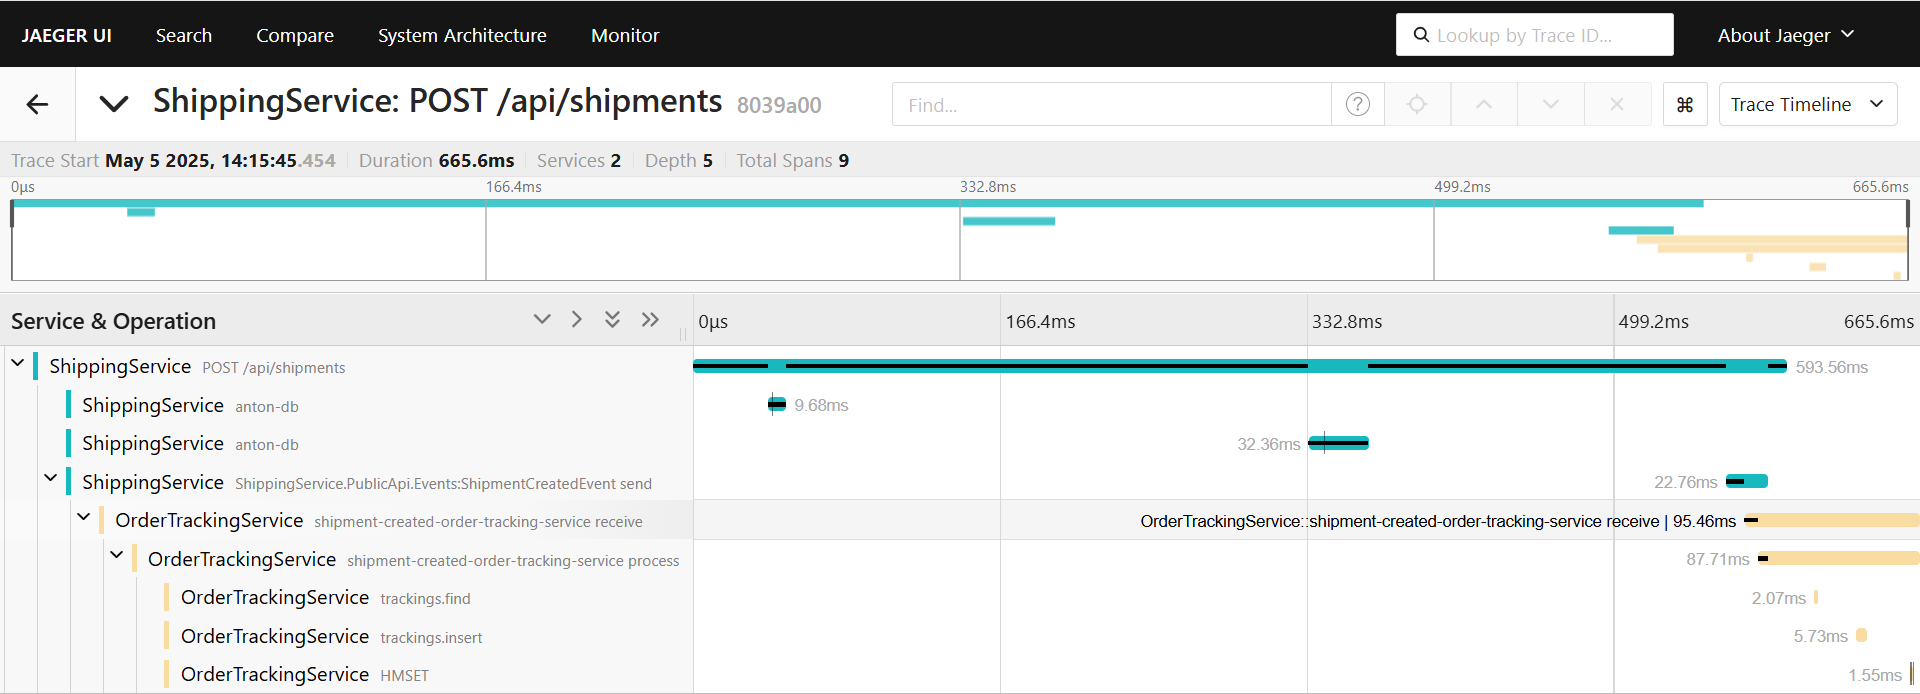
As you can see on this screenshot, we have 2 services involved: ShippingService (blue traces) and OrderTrackingService (yellow traces).
ShippingService saves shipment to the Postgres database and sends a ShipmentCreatedEvent to RabbitMQ using MassTransit.
After that OrderTrackingService consumes the event and saves the shipment tracking to MongoDB and Redis.
You can review all the logs for this particular trace (Web API request to create a shipment) and see what components were involved, what actions they executed, and how much time these actions took. Each action of a given trace is called a span.
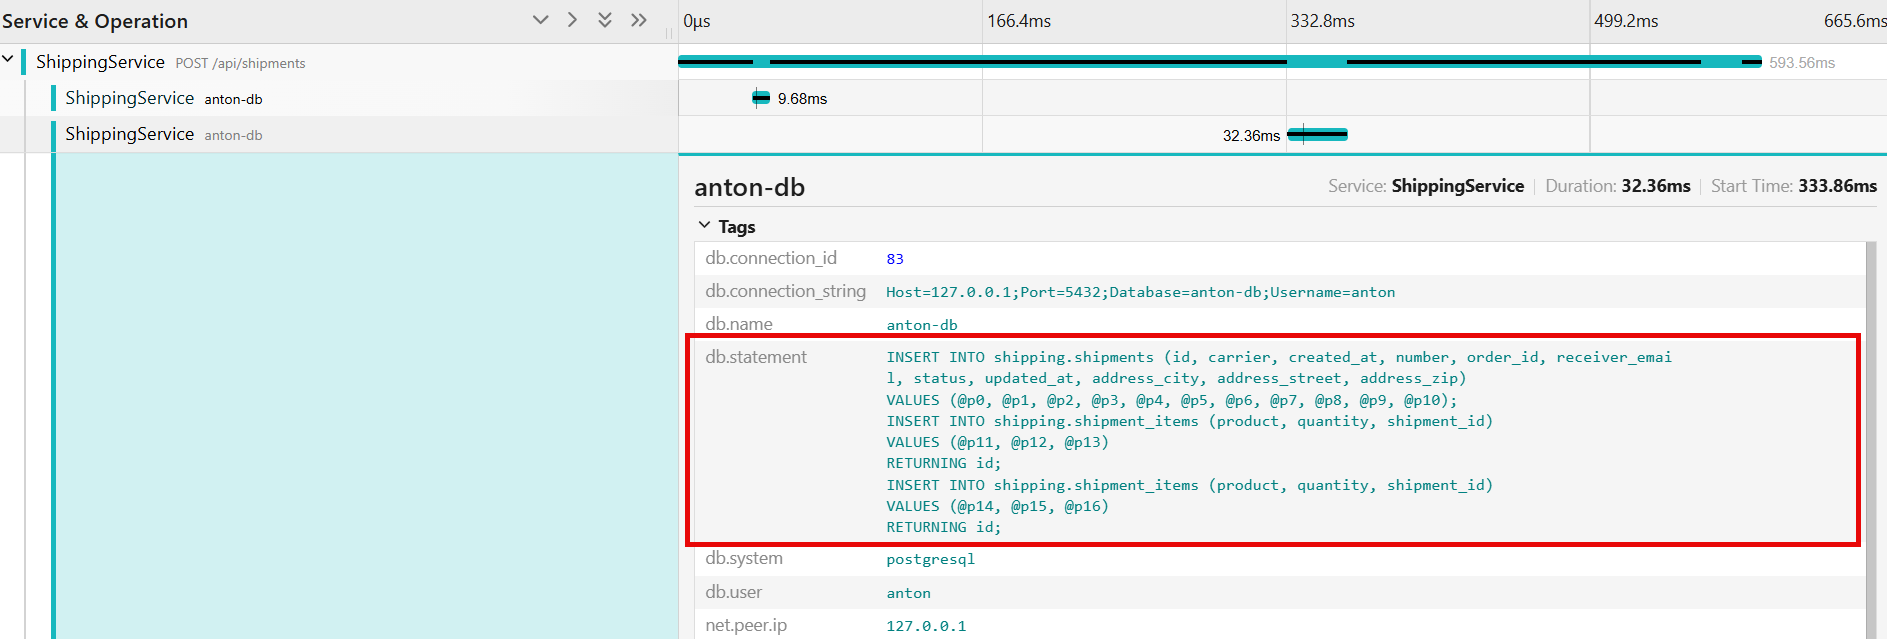
In Jaeger, you can click on a span to see more details, for example, you can examine the database query:
Jaeger is excellent for visualizing traces but doesn't handle logs and metrics. For a more comprehensive solution, let's look at Seq.
How To View OpenTelemetry Data in Seq
Seq is a centralized log server that allows you to collect and analyze structured log events. It provides powerful querying capabilities and a user-friendly interface to visualize logs and traces.
Seq allows viewing logs and distributed traces in one place, so I find it really handy.
Seq has a free and pro license, and as stated on their github you can use Seq in development and in production as long as you meet the "Individual" requirements.
In this blog post I explained how to setup Serilog to send logs to Seq in a few easy steps.
You can run Seq as a docker container:
ymlseq: image: datalust/seq:2024.3 container_name: seq restart: always environment: - ACCEPT_EULA=Y volumes: - ./docker_data/seq:/data ports: - "5341:5341" - "8081:80"
To configure Seq to ingest and index traces - just swap the settings in the appsettings.json:
json{ "OTEL_EXPORTER_OTLP_ENDPOINT": "http://localhost:5341/ingest/otlp/v1/traces", "OTEL_EXPORTER_OTLP_PROTOCOL": "http/protobuf", "OTEL_EXPORTER_OTLP_HEADERS": "X-Seq-ApiKey=abcde12345" }
When running in production mode, you need to create an API Key.
I like creating two separate API keys: one for logging and another for tracing.
The logging API Key can be configured to accept log events of a concrete log level, like Information or Debug, based on your needs.
The tracing API Key should be created without specifying any specific log level; otherwise, traces won't be ingested by Seq.
When running Seq locally or in production, it is important to enable user authorization and create a default admin account before creating API Keys and sending logs and traces.
You can access Seq UI at http://localhost:8081/.
Let's explore how the same trace for the "Create Shipment" use case looks in Seq:
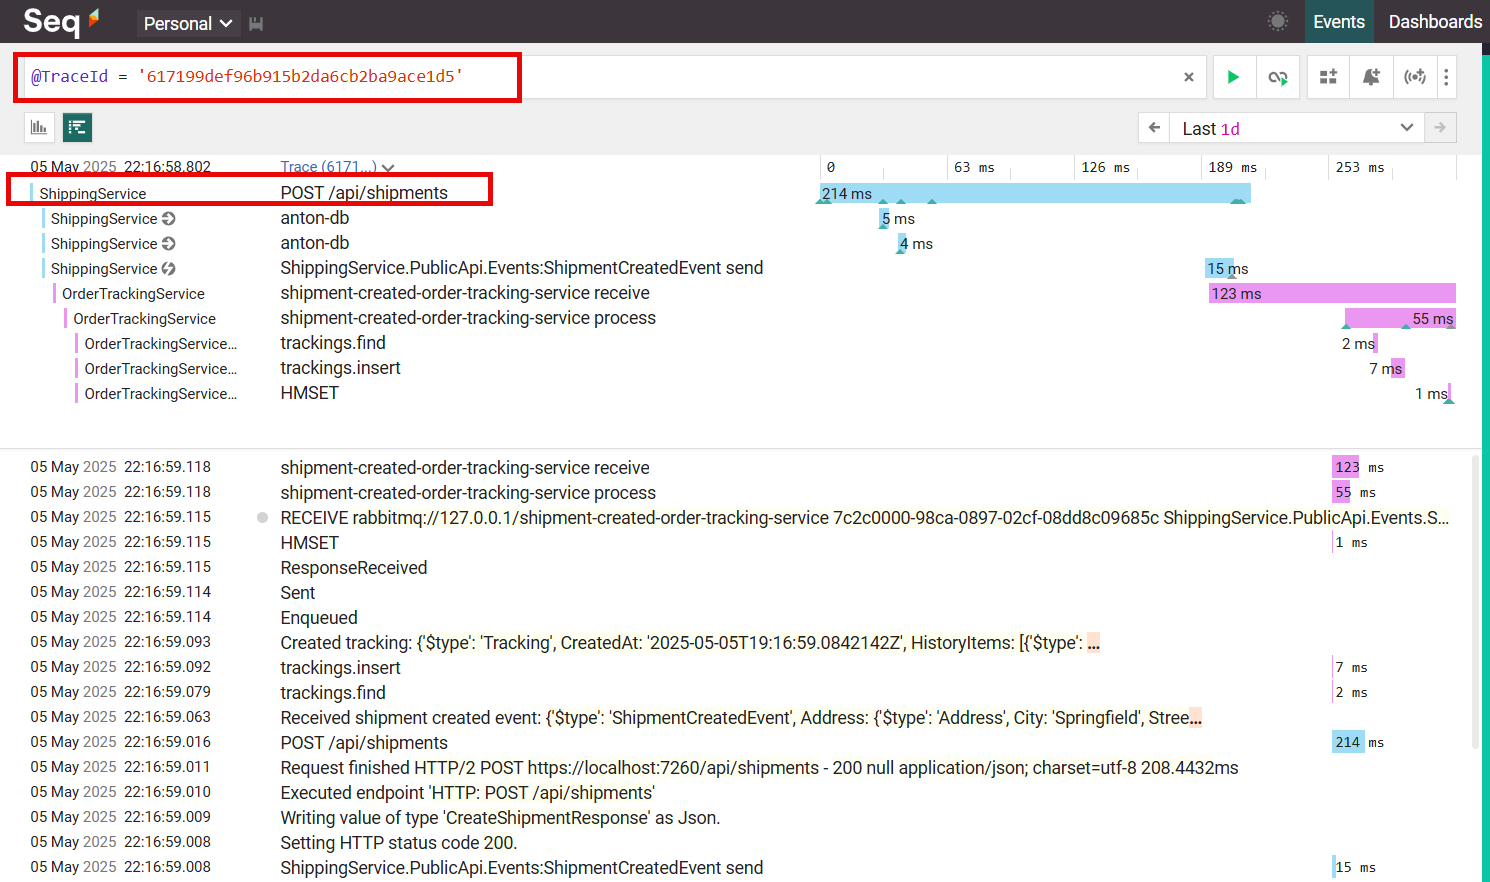
In Seq you can select a span to see more details about it:
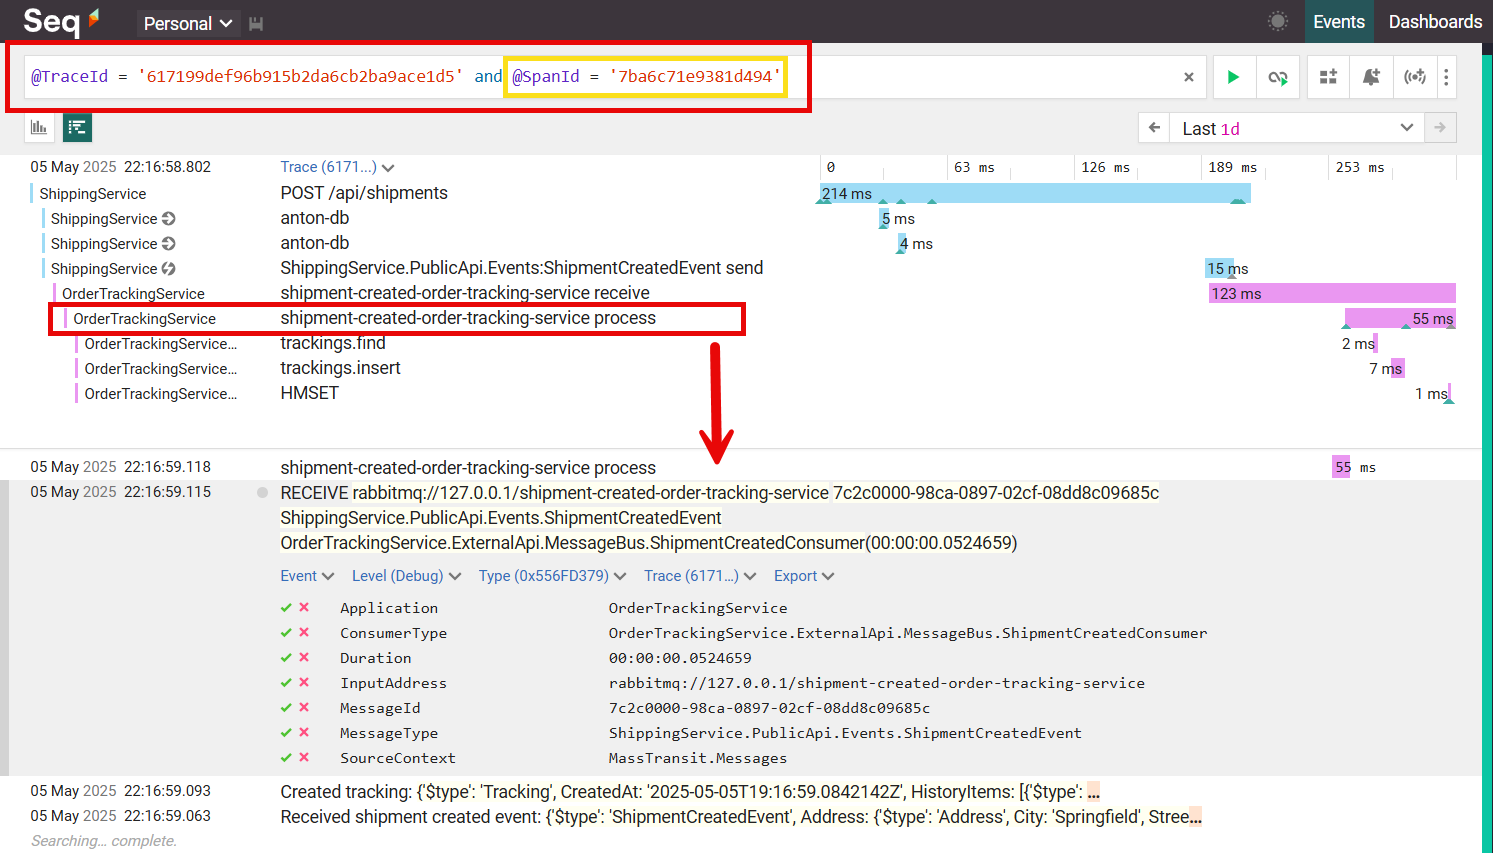
Seq allows you to quickly find the errors within your logs:
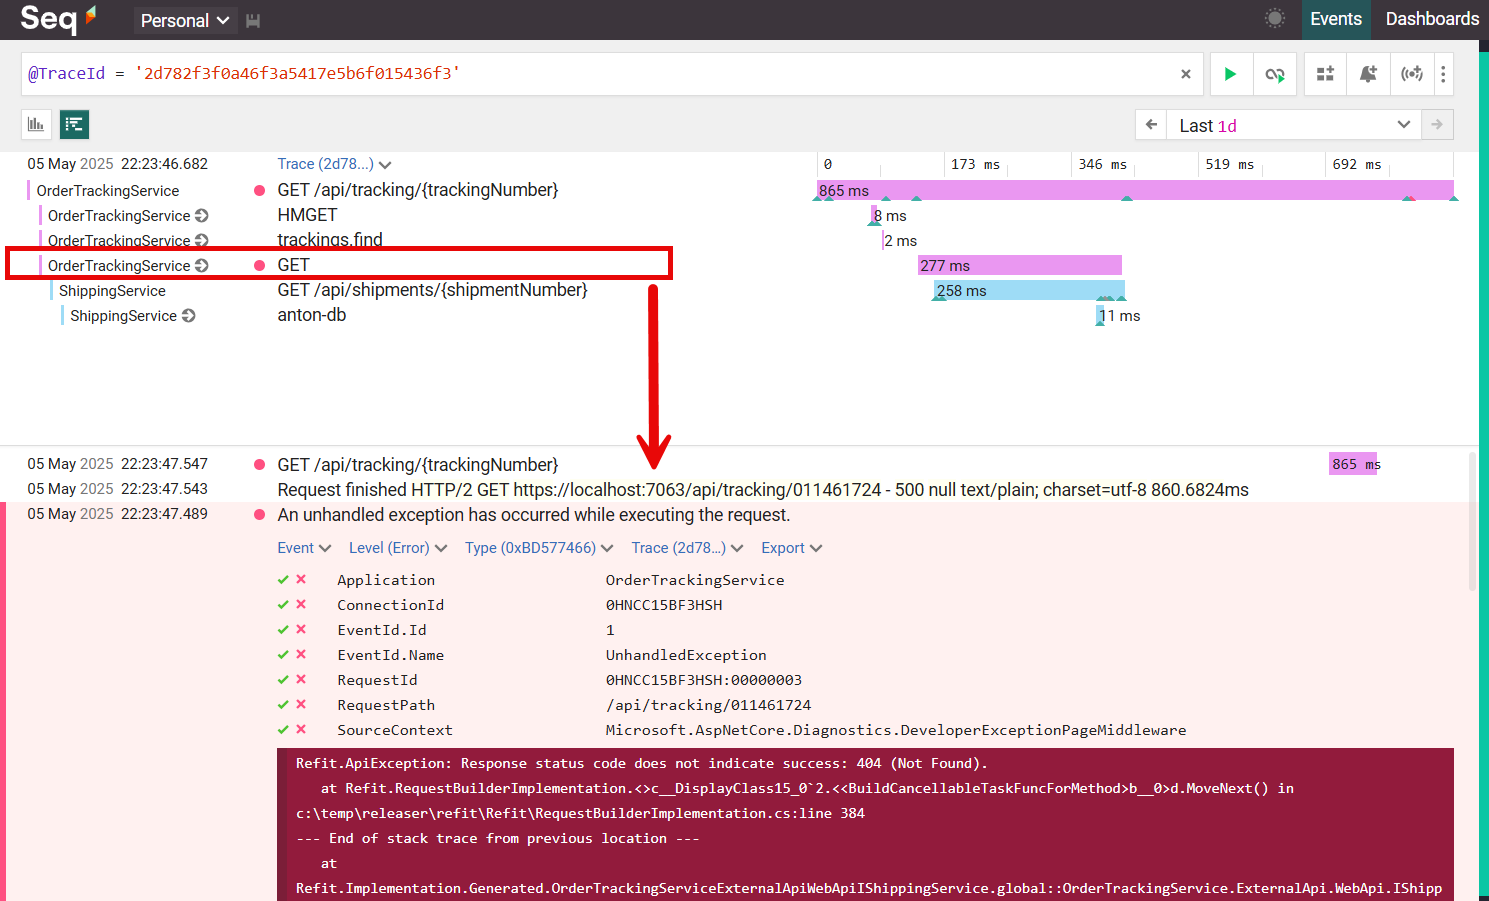
As you can see, this request failed because a tracked shipment was not found in the ShippingService.
If you want to see OpenTelemetry in action, you can download the source for two complete services at the end of the article.
Adding Custom Traces and Properties
While automatic instrumentation is convenient, adding custom traces and properties gives you more control and insight into your application's behavior.
Custom traces allow you to measure specific operations in your code.
Custom properties (or attributes) provide additional context about a span. They can include business data, technical details, or any other relevant information.
Here's how to create a custom trace for sending email via MailKit:
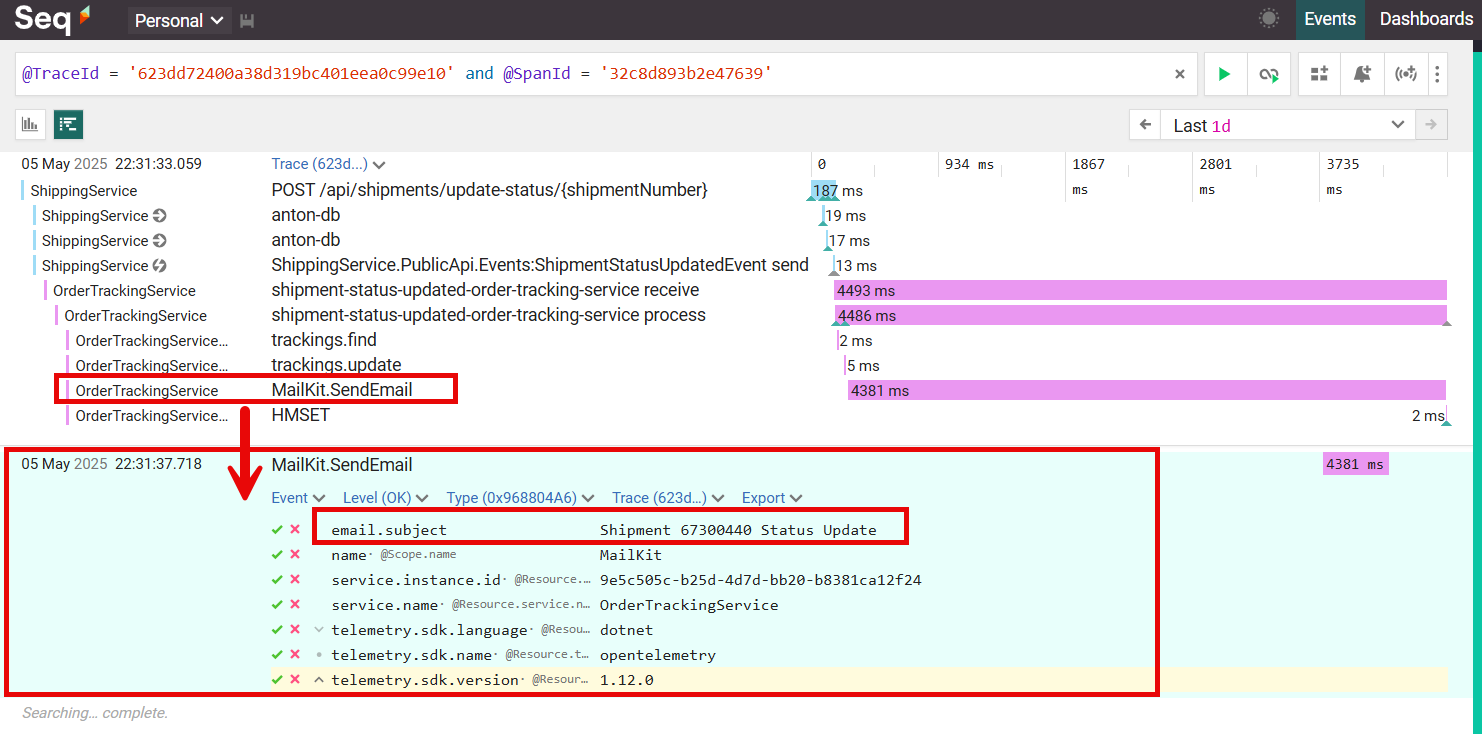
csharppublic class OpenTelemetryEmailService(IEmailService emailService) : IEmailService { public async Task SendAsync(EmailRequest request, CancellationToken cancellationToken) { var tracer = TracerProvider.Default.GetTracer("MailKit"); using var span = tracer.StartActiveSpan("MailKit.SendEmail"); span.SetAttribute("email.subject", request.Subject); try { await emailService.SendAsync(request, cancellationToken); span.SetStatus(Status.Ok); } catch (Exception ex) { span.SetStatus(Status.Error.WithDescription(ex.Message)); throw; } } }
You can create a custom trace with TracerProvider and create a span MailKit.SendEmail.
You can add any custom attributes to the span, for example, email subject line.
Any code you execute before the span is disposed - will be a part of this span. Just like custom logging scopes in Serilog or Microsoft.Logging.
Here is what it looks like in Seq:
When adding custom traces and properties, follow these best practices:
- Be Selective: Don't trace everything; focus on important operations and business processes.
- Use Consistent Naming: Adopt a consistent naming convention for spans and attributes; kebab-case is mostly used.
- Add Meaningful Attributes: Include attributes that will help with troubleshooting and analysis.
- Record Exceptions: Always record exceptions in spans to make error analysis easier.
- Create Span Hierarchies: Use parent-child relationships to show how operations relate to each other.
- Respect Privacy: Don't include personally identifiable information (PII) or sensitive data in spans.
- Consider Performance: While instrumentation overhead is generally low, be mindful of creating too many spans in hot paths.
Summary
OpenTelemetry provides a powerful framework for gaining visibility into your applications, whether they're monoliths or microservices.
By implementing OpenTelemetry, you can:
- Collect Unified Telemetry Data: Gather logs, metrics, and traces using a standardized approach.
- Understand Application Behavior: Gain insights into how your application performs in production.
- Diagnose Issues Quickly: Identify the root cause of problems by correlating different types of telemetry data.
- Make Data-Driven Decisions: Use observability data to inform architectural and operational decisions.
Getting started with OpenTelemetry is not hard if you follow the steps from this guide.
Both Seq and Jaeger are excellent tools for distributed tracing, but there is no obvious choice on which is better:
Jaeger:
- Is free and open-source
- Doesn't support logging
- Doesn't have built-in authorization; you need to use 3rd party tools to secure access to Jaeger
Seq:
- Supports both logs and traces
- Seq is free for individual use but paid for teams
Prometheus and Grafana can be a good alternative.
Choose whatever fits your needs more.
Hope you find this newsletter useful. See you next time.
