In modern microservice architectures, observability is crucial for understanding the interactions and behaviors of your services. Implementing structured logging and distributed tracing helps in diagnosing issues and monitoring system performance. In this blog post, we'll explore how to use Seq for these purposes.
Seq is a centralized log server that allows you to collect and analyze structured log events. It provides powerful querying capabilities and a user-friendly interface to visualize logs and traces. Starting from version 2024.1, Seq fully supports distributed tracing, including OpenTelemetry trace ingestion, trace indexing, and hierarchical trace visualization.
Previously I was using Jaeger - one of the most popular services for distributed tracing. But now, Seq allows viewing logs and traces in one place, so I find it more handy than having 2 separate services for logs and distributed traces.
Seq has a free and pro license, and as stated on their github you can use Seq in development and in production as long as you meet the "Individual" requirements.
Now let's dive into structured logging, distributed tracing and OpenTelemetry.
Structured logging is a practice of logging events in a consistent, structured format, storing log event parameters as key-value pairs. This approach allows logs to be more easily searched, filtered and analyzed, compared to traditional text logs.
Benefits of Structured Logging:
- Enhanced Querying: you can filter and search logs based on specific event parameters.
- Better Analysis: logs can be aggregated and visualized more effectively.
- Machine-readable: tools like Seq can parse and display logs in a meaningful way.
Distributed tracing allows monitoring and troubleshooting requests as they travel across various components or microservices in a distributed system. It helps to visualize the flow of requests and identify bottlenecks or failures.
Distributed tracing turns on the lights on the requests your application sends to the database, distributed cache, message queue, event bus or other services.
Key Concepts of Distributed Tracing:
- Spans: individual units of work within a trace. Typically, represents one request to an external system (database, cache, etc).
- Traces: a collection of spans representing a request across multiple services.
- Context Propagation: passing trace context across service boundaries to correlate spans.
OpenTelemetry is an open-source observability framework that provides APIs, libraries, and tools to instrument, generate, collect, and export telemetry data (metrics, logs, and traces) for analysis.
Key Features of OpenTelemetry:
- Language Support: Supports multiple programming languages.
- Vendor-neutral: Works with different backends (e.g., Seq, Jaeger, Prometheus).
- Instrumentation Libraries: Provides out-of-the-box instrumentation for various frameworks.
To use Seq for structured logging and distributed tracing, we need to follow these steps:
- Install the Seq server on your machine or spin up the Seq docker container.
- Configure your microservices to send structured log events to Seq.
- Instrument your microservices with OpenTelemetry to generate and propagate traces.
- Configure Seq to ingest and index the traces.
- Use the Seq user interface to visualize and analyze the logs and traces.
Let's dive into each step in detail.
Today we will be building two microservices: ShippingService and OrderTrackingService.
ShippingService will be responsible for creating and updating shipments for purchased products.
OrderTrackingService will be responsible for tracking shipment status and notifying users of shipment updates via email.
We will be building simplified versions of these services, so I can show you how to implement structured logging and distributed tracing. And later we'll explore Seq to visualize all these data.
Technologies we will be using to create ShippingService and OrderTrackingService:
- ASP.NET Core, minimal APIs (vertical slices architecture for organizing code)
- MongoDB (for data storage)
- MediatR (for CQRS pattern)
- MassTransit (for event-driven architecture with RabbitMQ)
- Refit (for synchronous communication between services)
- Redis (for caching)
- MailKit (for sending emails)
- OpenTelemetry (for distributed tracing)
- Serilog (for structured logging)
- Docker for running MongoDB, RabbitMQ, Redis and Seq containers
NOTE: For building Shipping and OrderTracking microservices I used Vertical Slices Architecture; you can build your own Vertical Slices, use Clean Architecture or more simple Layered Architecture.
First, you need to install the MondoDB, RabbitMQ, Redis and Seq docker container using docker-compose-yml:
yamlservices:
  mongodb:
    image: mongo:latest
    container_name: mongodb
    environment:
      - MONGO_INITDB_ROOT_USERNAME=admin
      - MONGO_INITDB_ROOT_PASSWORD=admin
    volumes:
      - ./docker_data/mongodb:/data/db
    ports:
      - "27017:27017"
    restart: always
    networks:
      - docker-web

  rabbitmq:
    image: rabbitmq:3-management
    container_name: rabbitmq
    ports:
      - "15672:15672"
      - "5672:5672"
    restart: always
    volumes:
      - ./docker_data/rabbitmq:/var/lib/rabbitmq
    networks:
      - docker-web

  redis:
    image: redis:latest
    container_name: redis
    ports:
      - "6379:6379"
    restart: always
    volumes:
      - ./docker_data/redis:/data
    networks:
      - docker-web

  seq:
    image: datalust/seq:2024.3
    container_name: seq
    restart: always
    environment:
      - ACCEPT_EULA=Y
    volumes:
      - ./docker_data/seq:/data
    ports:
      - "5341:5341"
      - "8081:80"
    networks:
      - docker-web

networks:
  docker-web:
    driver: bridge
To ensure that data is persisted across docker restarts - we are configuring volumes for all the docker containers.
ShippingService implements the following use cases, available publicly in webapi:
- Create Shipment
- Update Shipment Status
- Get Shipment By Number
1. Create Shipment: saves shipment details to MongoDB, publishes ShipmentCreatedEvent to a RabbitMQ and returns a shipment number.
2. Update Shipment Status: updates the status of a shipment in MongoDB and publishes ShipmentStatusUpdatedEvent to a RabbitMQ.
3. Get Shipment By Number: retrieves information about shipment from MongoDB.
Let's have a look at the implementation of "Create Shipment" use case:
csharpprivate sealed record CreateShipmentRequest(
    string OrderId,
    Address Address,
    string Carrier,
    string ReceiverEmail,
    List<ShipmentItem> Items);

internal sealed record CreateShipmentResponse(string ShipmentNumber);

app.MapPost("/api/shipments",
    async ([FromBody] CreateShipmentRequest request, IMediator mediator) =>
    {
        var command = new CreateShipmentCommand(
            request.OrderId,
            request.Address,
            request.Carrier,
            request.ReceiverEmail,
            request.Items);

        var response = await mediator.Send(command);
        if (response.IsError)
        {
            return Results.BadRequest(response.Errors);
        }

        return Results.Ok(response.Value);
    });
I use minimal APIs to create webapi endpoints and MediatR library for CQRS pattern.
Here I create a command to create a shipment, let's explore the command handler Handle method:
csharppublic async Task<ErrorOr<CreateShipmentResponse>> Handle(
    CreateShipmentCommand request,
    CancellationToken cancellationToken)
{
    var shipmentAlreadyExists = await context.Shipments
        .Find(s => s.OrderId == request.OrderId)
        .AnyAsync(cancellationToken);

    if (shipmentAlreadyExists)
    {
        logger.LogInformation("Shipment for order '{OrderId}' is already created", request.OrderId);
        return Error.Failure($"Shipment for order '{request.OrderId}' is already created");
    }

    var shipmentNumber = new Faker().Commerce.Ean8();
    var shipment = CreateShipment(request, shipmentNumber);

    await context.Shipments.InsertOneAsync(shipment, cancellationToken: cancellationToken);

    logger.LogInformation("Created shipment: {@Shipment}", shipment);

    var shipmentCreatedEvent = CreateShipmentCreatedEvent(shipment);
    await bus.Publish(shipmentCreatedEvent, cancellationToken);

    return new CreateShipmentResponse(shipment.Number);
}
After a shipment is saved in the database, a ShipmentCreatedEvent is sent to RabbitMQ using MassTransit.
When working with MongoDB I like creating a MongoDbContext class that encapsulates all IMongoCollections:
csharppublic class MongoDbContext(IMongoClient mongoClient)
{
    private readonly IMongoDatabase _database = mongoClient.GetDatabase("shipping");

    public IMongoCollection<Shipment> Shipments => _database.GetCollection<Shipment>("shipments");
}
I find this approach useful as I can keep all the database and collection names in one place.
For request-response I like using positional records. For entities - classes with init only properties marked as required.
For my application logic classes, like CommandHandlers, I like using primary constructors to avoid boilerplate code.
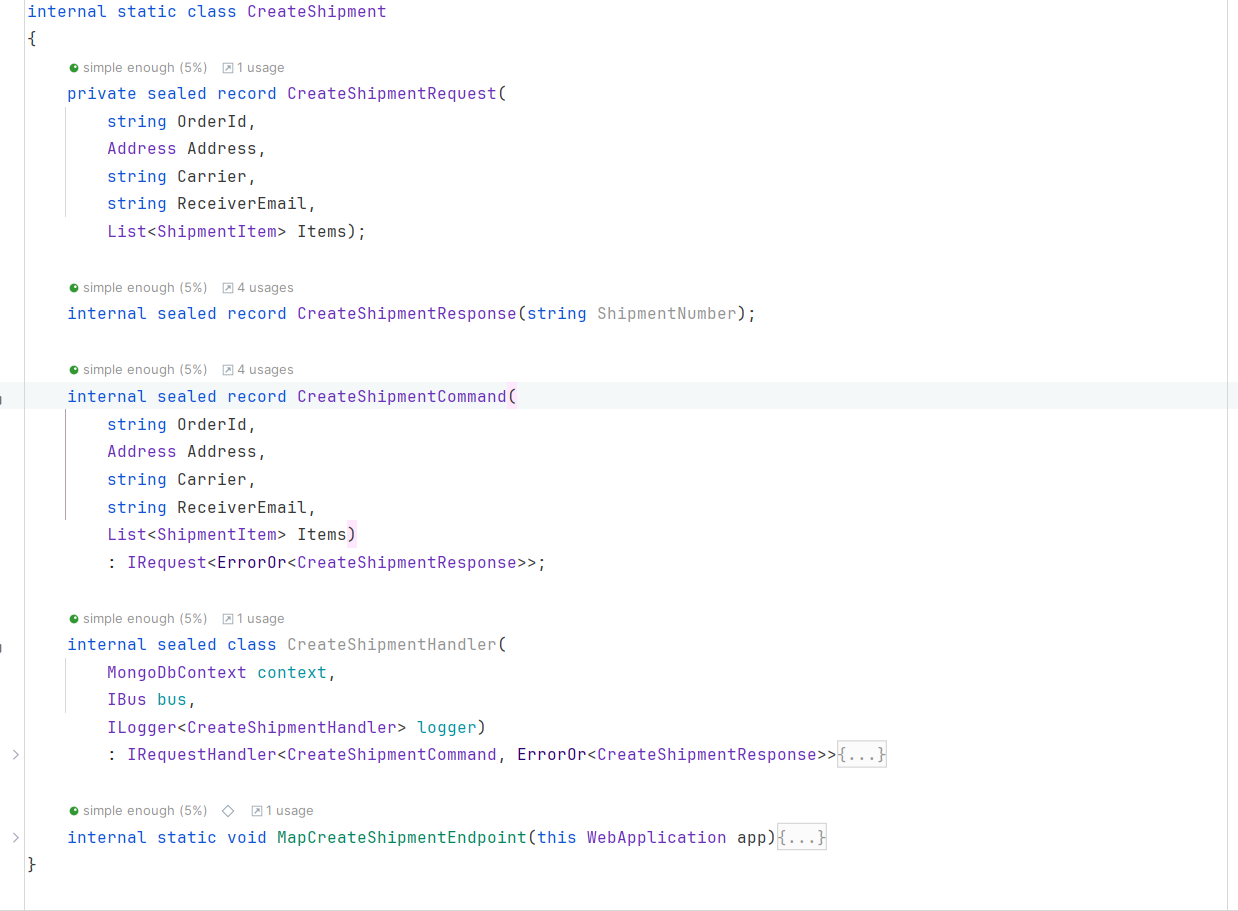
My vertical slice for this use case looks as follows:
OrderTrackingService implements the following use cases:
- Create Tracking (internal)
- Update Tracking Status (internal)
- Get Tracking by Number (public, available in webapi)
1. Create Tracking: saves shipment tracking to MongoDB and Redis.
2. Update Tracking Status: consumes shipment status updates from RabbitMQ, updates MongoDB, refreshes Redis cache, and sends email notifications to users.
OrderTrackingService consumes ShipmentCreatedEvent and ShipmentStatusUpdatedEvent events from a RabbitMQ.
To improve the performance of the application, trackings are saved to Redis for fast data reads when a client requests a shipment status.
3. Get Tracking by Number: returns information of a tracked shipment by a given number. Let's have a look at the implementation of this use case:
csharpinternal sealed record TrackingResponse(
    string Number,
    ShipmentStatus Status,
    ShipmentDetails ShipmentDetails,
    List<TrackingHistoryItem> HistoryItems);

app.MapGet("/api/tracking/{trackingNumber}",
    async ([FromRoute] string trackingNumber, IMediator mediator) =>
{
    var response = await mediator.Send(new GetTrackingByNumberQuery(trackingNumber));
    return response is not null ? Results.Ok(response) : Results.NotFound($"Tracking with number '{trackingNumber}' not found");
});
The "Receive Shipment Updates" QueryHandler looks for the tracked shipment in Redis, then in MongoDB and if not found, sends an HTTP request to the ShippingService to retrieve a shipment.
Let's explore the query handler Handle method, step by step:
csharppublic async Task<TrackingResponse?> Handle(GetTrackingByNumberQuery request, CancellationToken cancellationToken)
{
    // First, look in Redis:
    var tracking = await GetTrackingFromCacheAsync(request.TrackingNumber);
    if (tracking is not null)
    {
        return CreateTrackingResponse(tracking);
    }

    // If not found - look in MongoDB:
    tracking = await GetTrackingFromDbAsync(request, cancellationToken);
    if (tracking is not null)
    {
        await SaveTrackingInCacheAsync(tracking);
        return CreateTrackingResponse(tracking);
    }

    // ...
}
If a tracking is not found in neither Redis nor Mongo, an HTTP request is sent to the ShippingService to get the shipping details:
csharplogger.LogInformation("Tracking with number {TrackingNumber} not found in the database. Sending request to shipping-service", request.TrackingNumber);

var shipment = await shippingService.GetShipmentAsync(request.TrackingNumber);
if (shipment is null)
{
    logger.LogDebug("Shipment by tracking number {TrackingNumber} not found", request.TrackingNumber);
    return null;
}
If a shipment is found - we can create a tracking in OrderTrackingService MongoDB and save it to Redis:
csharpvar command = new CreateTracking.CreateTrackingCommand(shipment);

var response = await mediator.Send(command, cancellationToken);
if (response.IsError)
{
    logger.LogDebug("Tracking with number {TrackingNumber} not found", request.TrackingNumber);
    return null;
}

tracking = response.Value;

await SaveTrackingInCacheAsync(tracking);
return CreateTrackingResponse(tracking);
OrderTrackingService has RabbitMQ consumer that are subscribed to the events from the ShippingService, let's have a look on the their implementation using MassTransit:
csharppublic async Task Consume(ConsumeContext<ShipmentCreatedEvent> context)
{
    var message = context.Message;

    logger.LogInformation("Received shipment created event: {@Event}", message);

    var shipment = CreateShipment(message);
    var command = new CreateTracking.CreateTrackingCommand(shipment);

    var response = await mediator.Send(command, context.CancellationToken);
    if (response.IsError)
    {
        logger.LogDebug("Shipment by tracking number {TrackingNumber} not found", message.Number);
        return;
    }

    await SaveTrackingInCacheAsync(response.Value);
}

public async Task Consume(ConsumeContext<ShipmentStatusUpdatedEvent> context)
{
    var message = context.Message;

    logger.LogInformation("Received shipment status updated event: {@Event}", message);

    var command = new UpdateTrackingStatus.UpdateTrackingCommand(message.ShipmentNumber, message.Status);

    var response = await mediator.Send(command);
    if (response.IsError)
    {
        logger.LogDebug("Shipment by tracking number {TrackingNumber} not found", message.ShipmentNumber);
        return;
    }

    await SaveTrackingInCacheAsync(response.Value);
}
These consumers are sending the respective mediator commands.
Now you have a good understanding of how these services work together. In the next step we will configure the structured logging using Serilog and send them to Seq.
To configure your microservices to send structured log events to Seq, you need to:
- Add the Serilog logging package to both microservices.
- Configure Serilog logging settings for each service
- Configure Serilog to send logs to the Seq server
- Write the necessary log events.
Serilog is a fast logging library that allows you to log structured data (key-value pairs) instead of plain text, making it easier to query and analyze logs.
We will be using the following aspects of Serilog:
- Structured Logging: Serilog allows you to log structured data (key-value pairs) instead of plain text, making it easier to query and analyze logs.
- Rich Data Context: you can enrich log events with contextual information, such as user IDs, request IDs, and other relevant metadata, providing deeper insights into application behavior.
- Flexible Sinks: Serilog supports a wide range of output destinations (sinks), including console, files, databases, and cloud logging platforms, allowing you to direct your logs to the most appropriate storage for your needs.
First, we need to add the following Nuget Packages (ShippingService):
csharp<PackageReference Include="Serilog.AspNetCore" Version="8.0.1" />
<PackageReference Include="Serilog.Sinks.Console" Version="6.0.0" />
<PackageReference Include="Serilog.Sinks.Seq" Version="8.0.0" />
We will be using Serilog.Sinks.Seq to send log events to Seq in docker container.
Now, we can add the Serilog logging configuration to appsettings.json:
json{
  "Serilog": {
    "Using": [
      "Serilog.Sinks.Console",
      "Serilog.Sinks.Seq"
    ],
    "MinimumLevel": {
      "Default": "Debug",
      "Override": {
        "Microsoft": "Information"
      }
    },
    "WriteTo": [
      { "Name": "Console" },
      {
        "Name": "Seq",
        "Args": {
          "serverUrl": "http://localhost:5341"
        }
      }
    ],
    "Enrich": [ "FromLogContext", "WithMachineName", "WithThreadId" ],
    "Properties": {
      "Application": "ShippingService"
    }
  }
}
Here, we configure logging to Console (don't use in production) and Seq.
We point the Seq's URL to http://localhost:5341 when running locally.
When running service inside a docker container - you need to use the docker container's name instead of a localhost: http://seq:5341.
Note that we are specifying an "Application": "ShippingService", this is important to distinguish an application source when viewing logs and traces in Seq.
To finish configuring Serilog - add it to the WebApplicationBuilder:
csharpvar builder = WebApplication.CreateBuilder(args);
builder.Host.UseSerilog((context, loggerConfig) => loggerConfig.ReadFrom.Configuration(context.Configuration));
The beauty of this approach is that you can use Microsoft ILogger interface for logging that under the hood calls Serilog.
Now let's look at how structured logging is done in the CreateShipmentHandler:
csharpvar shipmentAlreadyExists = await context.Shipments
    .Find(s => s.OrderId == request.OrderId)
    .AnyAsync(cancellationToken);

if (shipmentAlreadyExists)
{
    logger.LogInformation("Shipment for order '{OrderId}' is already created", request.OrderId);
    return Error.Failure($"Shipment for order '{request.OrderId}' is already created");
}

var shipmentNumber = new Faker().Commerce.Ean8();
var shipment = CreateShipment(request, shipmentNumber);

await context.Shipments.InsertOneAsync(shipment, cancellationToken: cancellationToken);

logger.LogInformation("Created shipment: {@Shipment}", shipment);

// ...
The log message "Shipment for order '{OrderId}' is already created" includes the OrderId as a structured property.
Instead of embedding the OrderId directly in the log message as plain text, it is passed as a named parameter.
This allows logging systems to capture OrderId as a separate, searchable field.
Please never do your logging this way, or you will end up with plain-text logs that are not searchable by important parameters:
csharplogger.LogInformation($"Shipment for order '{request.OrderId}' is already created");
The log message "Created shipment: {@Shipment}" uses the @ notation to serialize the shipment object into a structured format. This means that all the properties of the shipment object are logged as separate fields, preserving the structure and making it easier to analyze.
Another example of structured logging could be:
csharplogger.LogInformation("Shipment for order '{OrderId}' is already created", request.OrderId);
logger.LogInformation("Updated state of shipment {ShipmentNumber} to {NewState}", request.ShipmentNumber, request.Status);
By implementing logging in such a structured way, you will be able to search logs in Seq to get, for example, all the events related to a given ShipmentNumber, State or OrderId.
Let's explore an example where we search for shipments updated state to one of the values: "Processing", "Disptached", "InTransit":

Now that we have structured logs in place, let's add OpenTelemetry to our microservices.
To instrument your microservices with OpenTelemetry for tracing, follow these steps:
- Add the OpenTelemetry packages to each microservice project.
- Configure the OpenTelemetry tracer to generate and propagate traces.
- Set up the necessary trace context propagation.
First, we need to add the following Nuget Packages (OrderTrackingService):
csharp<PackageReference Include="MongoDB.Driver.Core.Extensions.DiagnosticSources" Version="1.4.0"/>
<PackageReference Include="OpenTelemetry.Exporter.OpenTelemetryProtocol" Version="1.8.1"/>
<PackageReference Include="OpenTelemetry.Extensions.Hosting" Version="1.8.1"/>
<PackageReference Include="OpenTelemetry.Instrumentation.AspNetCore" Version="1.8.1"/>
<PackageReference Include="OpenTelemetry.Instrumentation.Http" Version="1.8.1"/>
<PackageReference Include="OpenTelemetry.Instrumentation.Runtime" Version="1.8.1"/>
<PackageReference Include="OpenTelemetry.Instrumentation.StackExchangeRedis" Version="1.0.0-rc9.14"/>
I used
OpenTelemetry.Instrumentation.StackExchangeRedisversion1.0.0-rc9.14which is not the latest version. With the latest version of this package, my service stopped sending traces completely. So be careful when using non-stable versions of OpenTelemetry.Instrumentation. There is no release version for StackExchangeRedis yet.
To configure tracing, you need to add OpenTelemetry into DI:
csharpservices
    .AddOpenTelemetry()
    .ConfigureResource(resource => resource.AddService("OrderTrackingService"))
    .WithTracing(tracing =>
    {
        tracing
            .AddAspNetCoreInstrumentation()
            .AddHttpClientInstrumentation()
            .AddRedisInstrumentation()
            .AddSource(MassTransit.Logging.DiagnosticHeaders.DefaultListenerName)
            .AddSource("MongoDB.Driver.Core.Extensions.DiagnosticSources")
            .AddSource("MailKit");

        tracing.AddOtlpExporter();
    });
You need to configure the resource by specifying the service name and adding appropriate trace instrumentations:
- AddAspNetCoreInstrumentation - adds asp.net core traces
- AddHttpClientInstrumentation - adds traces when you send request using HTTP client
- AddRedisInstrumentation - adds traces from Redis
- AddSource("MassTransit") - adds traces for MassTransit and RabbitMQ
- AddSource("MongoDB") - adds traces for MongoDB
- AddSource("MailKit") - adds traces for sending emails using MailKit (custom implementation, see the source code)
Finally, you need to add the OpenTelemetry exporter.
As our traces are ready to go - let's configure Seq to ingest these traces.
To configure Seq to ingest and index traces - configure OpenTelemetry exporter to send traces to the Seq server.
You can do this in code using tracing.AddOtlpExporter(); method or set in the appsettings.json.
I prefer the latter:
json{
  "OTEL_EXPORTER_OTLP_ENDPOINT": "http://localhost:5341/ingest/otlp/v1/traces",
  "OTEL_EXPORTER_OTLP_PROTOCOL": "http/protobuf"
}
When running a service inside a docker container - you need to use the docker container's name instead of localhost: http://seq:5341.
When running in production mode, you need to create an API Key.
I like creating two separate API keys: one for logging and another for tracing.
The logging API Key can be configured to accept log events of a concrete log level, like Information or Debug, based on your needs.
The tracing API Key should be created without specifying any specific log level, otherwise traces won't be ingested by Seq.
You can specify the API Keys in the appsettings.json (some Serilog sections are omitted for brevity):
json{
  "Serilog": {
    "Using": [
      "Serilog.Sinks.Seq"
    ],
    "MinimumLevel": { },
    "WriteTo": [
      {
        "Name": "Seq",
        "Args": {
          "serverUrl": "http://seq:5341",
          "apiKey": "abcde123"
        }
      }
    ]
  },
  "OTEL_EXPORTER_OTLP_ENDPOINT": "http://localhost:5341/ingest/otlp/v1/traces",
  "OTEL_EXPORTER_OTLP_PROTOCOL": "http/protobuf",
  "OTEL_EXPORTER_OTLP_HEADERS": "X-Seq-ApiKey=abcde12345"
}
When running Seq locally or in production, it is important to enable user authorization and create a default admin account before creating API Keys and sending logs and traces.
Now, that we're all set, we can finally have a look at how Seq will visualize our structured logs and OpenTelemetry traces.
To visualize and analyze logs and traces in Seq, use the Seq user interface:
- Open the Seq user interface.
- Navigate to the "Events" section.
- Use the powerful querying capabilities to filter and search logs and traces.
- Explore the hierarchical trace visualization to understand the flow of requests.
Now let's explore some examples of structured logs and traces.
1. "Create Shipment" use case:
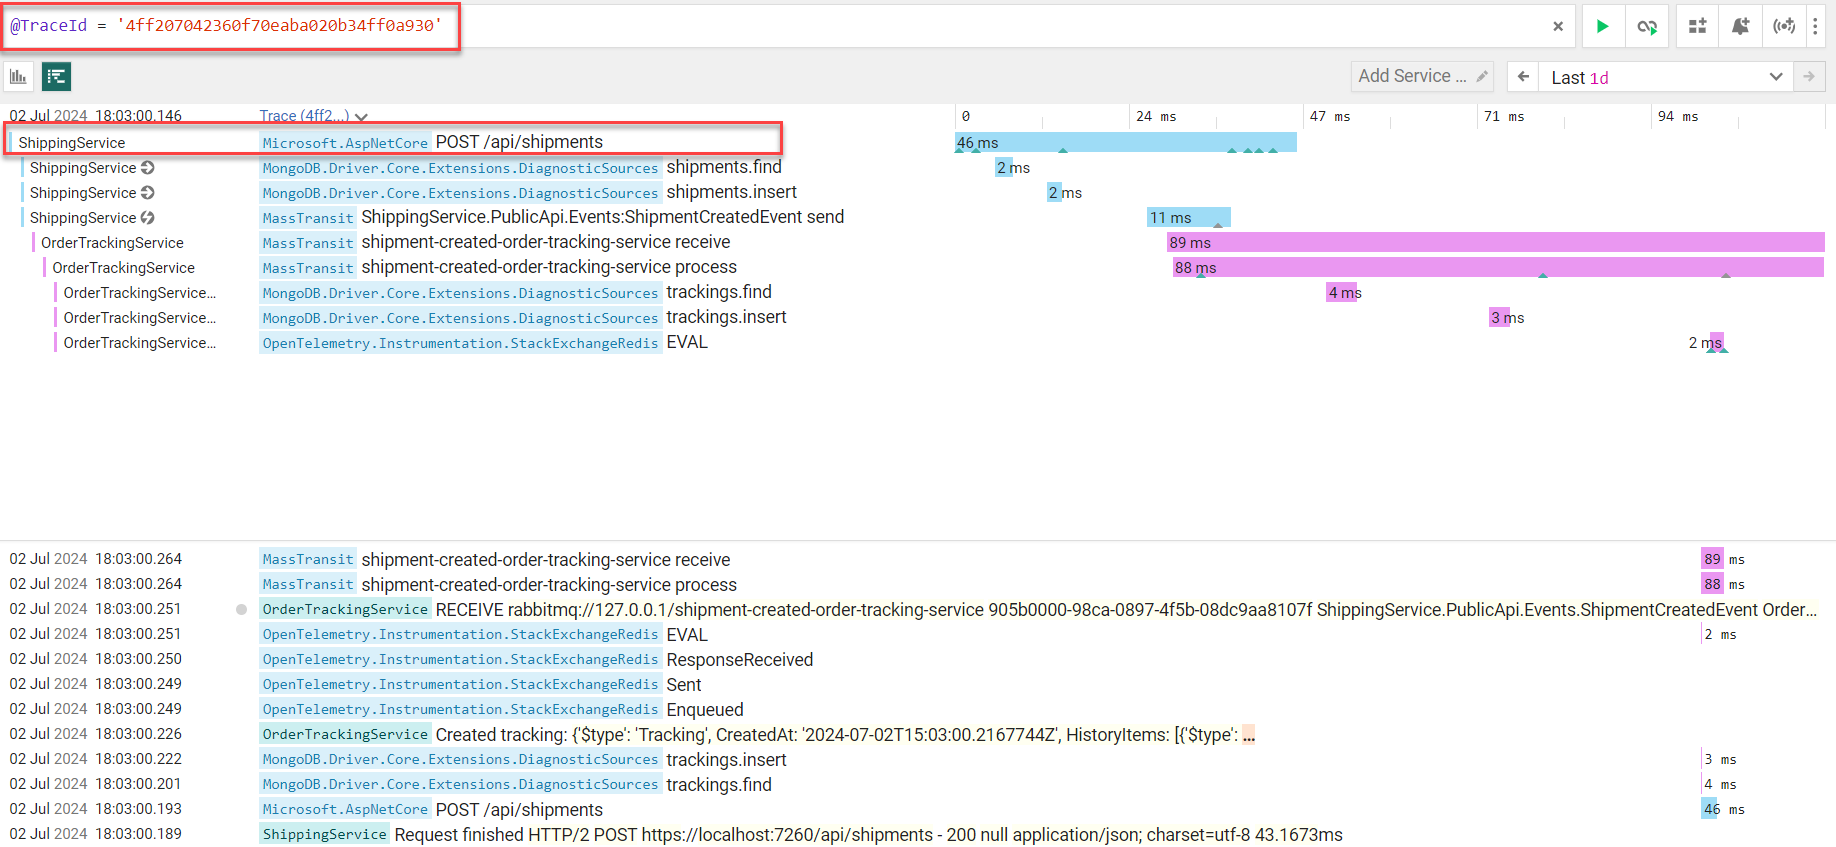
As you can see on this screenshot, we have 2 services involved: ShippingService (blue traces) and OrderTrackingService (purple traces).
ShippingService saves a shipment to its database and sends an ShipmentCreatedEvent to RabbitMQ using MassTransit.
After that OrderTrackingService consumes the event, saves the shipment tracking to MongoDB and Redis.
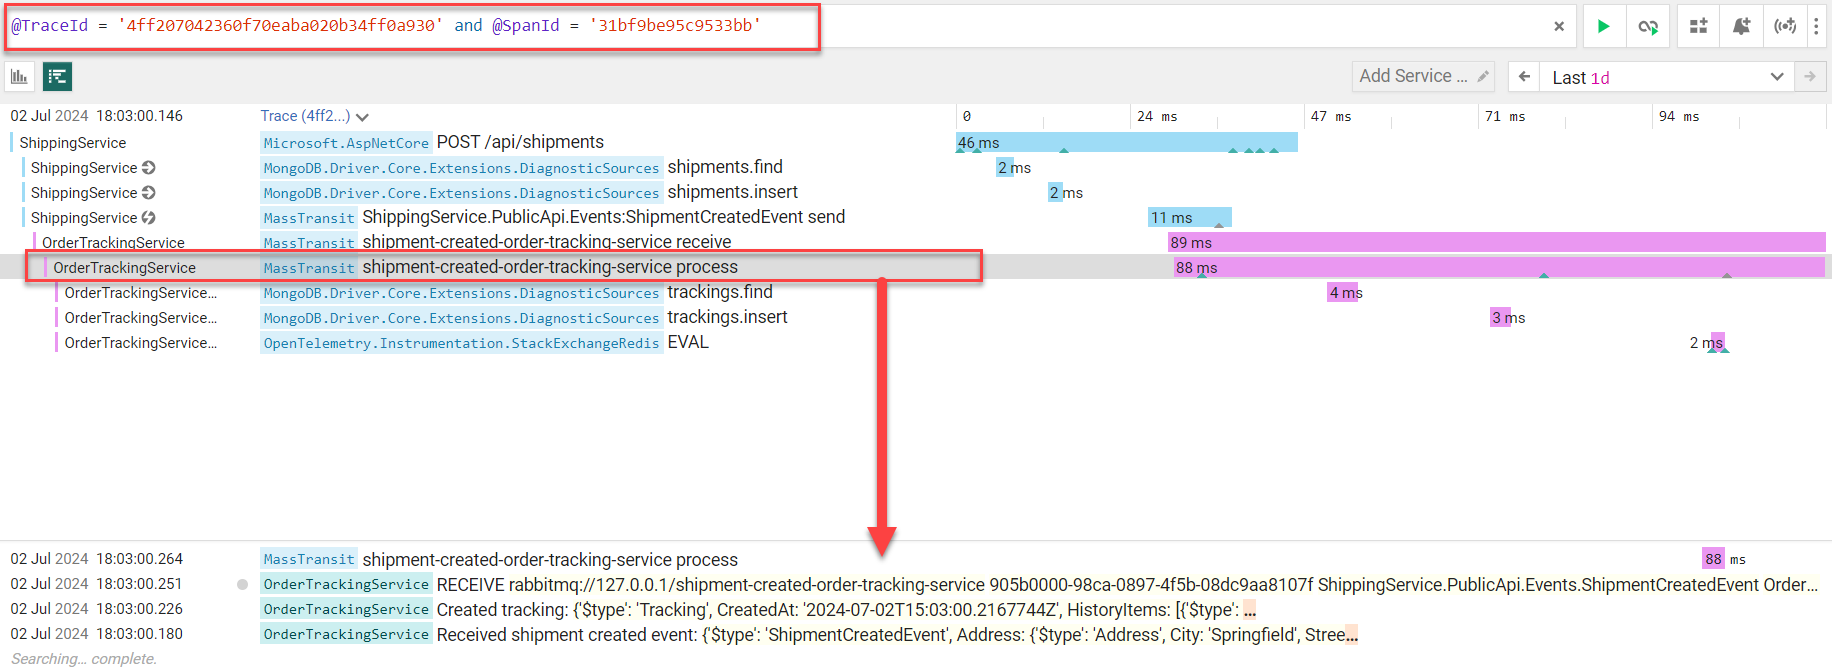
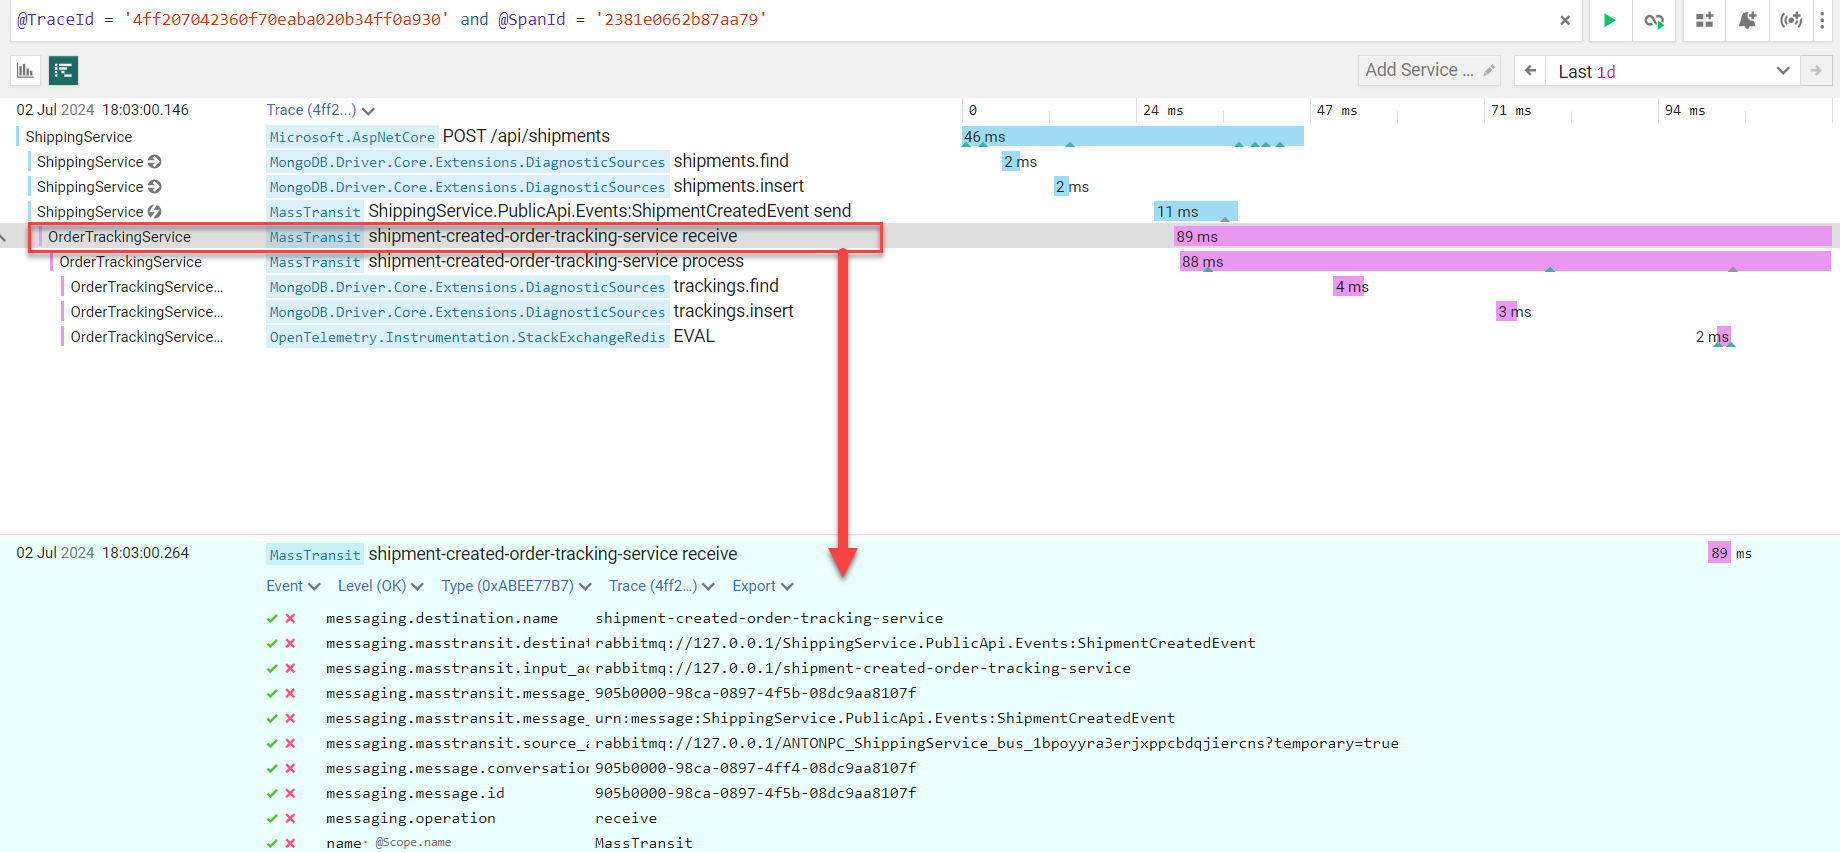
You can review all the logs for this particular trace (webapi request to create a shipment) and see what components were involved, what actions they executed and how much time these actions took. Each action of a given trace is called a span. In Seq you can select a span to see more details about it:
2. "Update Shipment Status" use case:
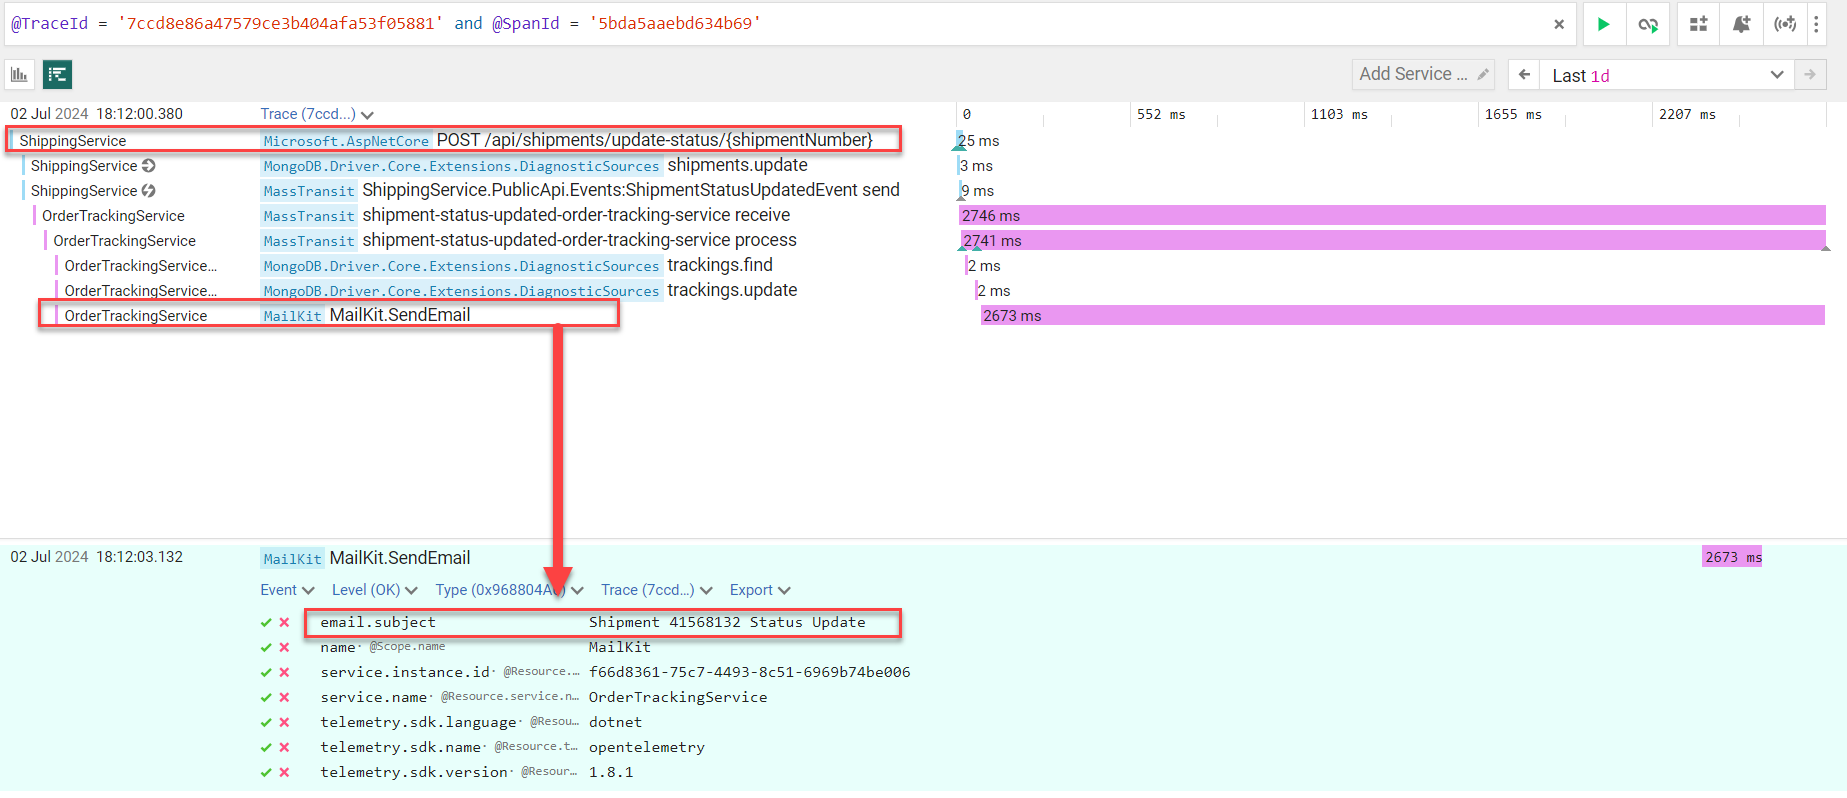
As you can see on this screenshot, this operation took almost 3 seconds. Why so long, you may ask?
And Seq gives us the answer - sending email took almost all the time.
Email is sent in the ShipmentStatusUpdatedEvent consumer in the background, and it's fine as it doesn't slow down the entire application or make a user to wait.
3. "Get Tracking by Number" use case:
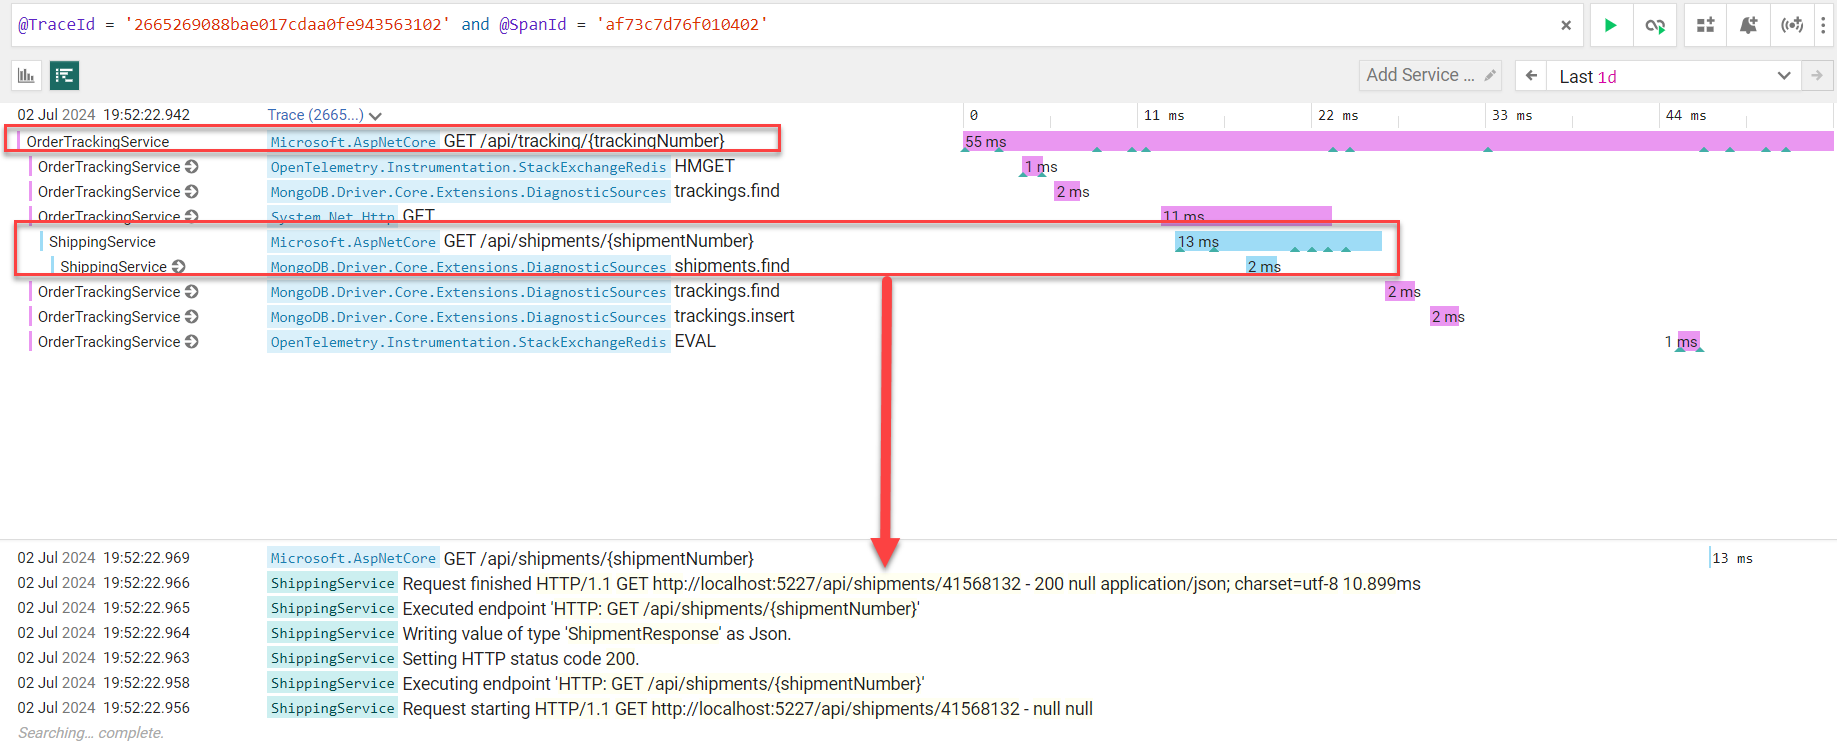
This traces shows the flow of this use case as I described earlier. OrderTrackingService tries to find a tracking inside Redis Cache, if not - in the MongoDB, if not - sends an HTTP request to ShippingService to retrieve a shipment that is being tracked. After a shipment is retrieved - OrderTrackingService continues its work.
4. Finding errors:
Seq allows you to quickly find the errors within your logs:
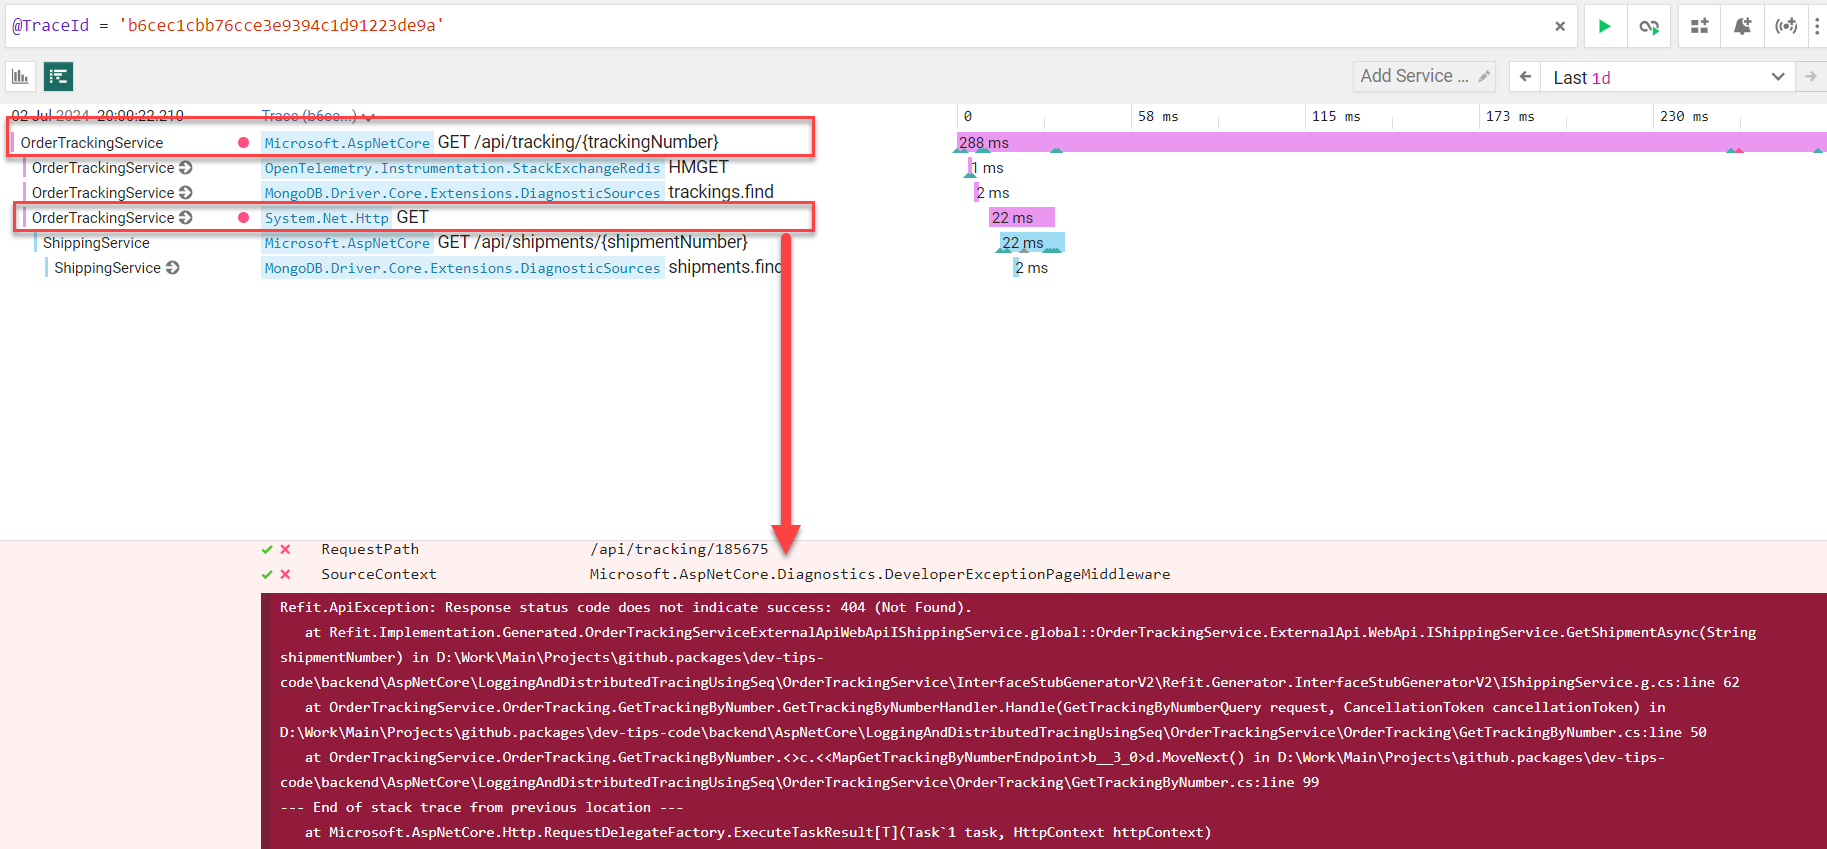
As you can see, this request failed because a tracked shipment was not found in the ShippingService.
Seq allows you to quickly find any issues in your applications, like errors, slow or failed requests. It gives a complete understanding of your request flow in the complex distributed systems, making it easier to troubleshoot and debug your applications.
Seq logging capabilities allow you to analyze log data much quicker and more efficiently. You can select logs to get statistics, insights and visualize all statistic data in charts with ease. You can also configure alerting in Seq to get notifications about errors, slow requests, important log messages or anything else that needs attention.
That's it! By following these steps, you can use Seq for structured logging and distributed tracing in your microservice architecture.
Using this manual, you can configure Serilog and OpenTelemetry exporter to send logs and traces into another instrument of your choice if Seq doesn't fit your needs. All you need to do is to make little tweaks in the appsettings.json without touching the code.
Hope you find this newsletter useful. See you next time.
