

Modern distributed systems rely on message-driven communication between microservices. In these systems, Apache Kafka often serves as the central system — handling millions of messages flowing between producers and consumers every day.
When your system grows, so does the traffic. Payments, transactions, alerts, or any event-based messages can pile up fast.
If your Kafka pipeline isn't properly tested under real load, small issues can quickly turn into major production outages. And these performance issues in production can cost you both money and trust.
NBomber is a powerful tool for simulating real-world load against Kafka in .NET applications. It lets you test producers, consumers, and end-to-end flows using scenarios written in C# or F#.
NBomber is protocol-agnostic by design. Unlike many tools, it doesn't depend on external packages for specific protocols, which makes it flexible enough to test anything from HTTP and WebSockets to gRPC, Kafka, NoSQL databases, or custom protocols.
Today, I will show you how to test a Kafka-based microservices system using NBomber. We will set up a fraud detection pipeline and simulate real-world traffic to find weaknesses before they show up in production.
In this post, we will explore:
- Why Load Testing Kafka Pipelines is Important
- Overview of the Fraud Detection Kafka Pipeline
- How to Use NBomber for Kafka Load Testing
- End-to-End Load Tests Across the Pipeline
- Custom Metrics You Should Track
Let's dive in.
Why Load Testing Kafka Pipelines is Important
Kafka is designed to be scalable, fault-tolerant, and durable. It can handle high volumes of data with low latency and high throughput. However, this does not mean that Kafka is immune to performance issues or failures.
Depending on your use case, data volume, data format, network conditions, hardware specifications, configuration settings, and code quality, you may encounter various challenges when using Kafka, such as:
- Message loss or duplication
- Broker overload or crash
- Security or compliance breaches
But Kafka doesn't exist in a vacuum. It's typically used to build ETL or streaming pipelines with multiple services or workers that publish, consume, and process messages in real time.
For many businesses, the speed of this Kafka pipeline can be crucial — especially when it impacts their SLA. When defining an SLO or SLA, latency for specific flows needs to remain consistent, which adds an additional challenge to running such pipelines efficiently and fast enough.
A Kafka-based pipeline may run smoothly in development when there's little traffic.
But in production, unexpected spikes can reveal hidden issues like:
- Concurrency issues.
- Inappropriate settings for handling Backpressure.
- I/O or serialization bottlenecks in message handling.
- Misconfigured partitioning that creates uneven load across consumers.
- Improper scaling of consumers for the expected load
- High latency spikes caused by concurrency issues in stateful or stateless message handling
- A long pipeline with multiple ETL workers, which contributes to high end-to-end latency
- Inappropriate usage of Kafka transactions, which requires coordination
- Commit acknowledge latency from all nodes
- Inappropriate strategy for committing offsets, which contributes to high latency
With NBomber, you can:
- Measure end-to-end latency between producing and consuming messages.
- Track how message throughput changes under an increasing load.
- Detect when the consumer starts lagging behind the producer.
Overview of the Fraud Detection Kafka Pipeline
Before diving into the load tests, let's take a closer look at the Kafka-based Fraud Detection microservices system we'll be testing.
We will be testing the core Kafka pipeline responsible for registering payments and performing fraud detection.
2 microservices are involved in the pipeline:
- PaymentService - responsible for processing and saving payments
- FraudDetectionService - responsible for fraud detection and approval
Here is the complete event flow of the system:
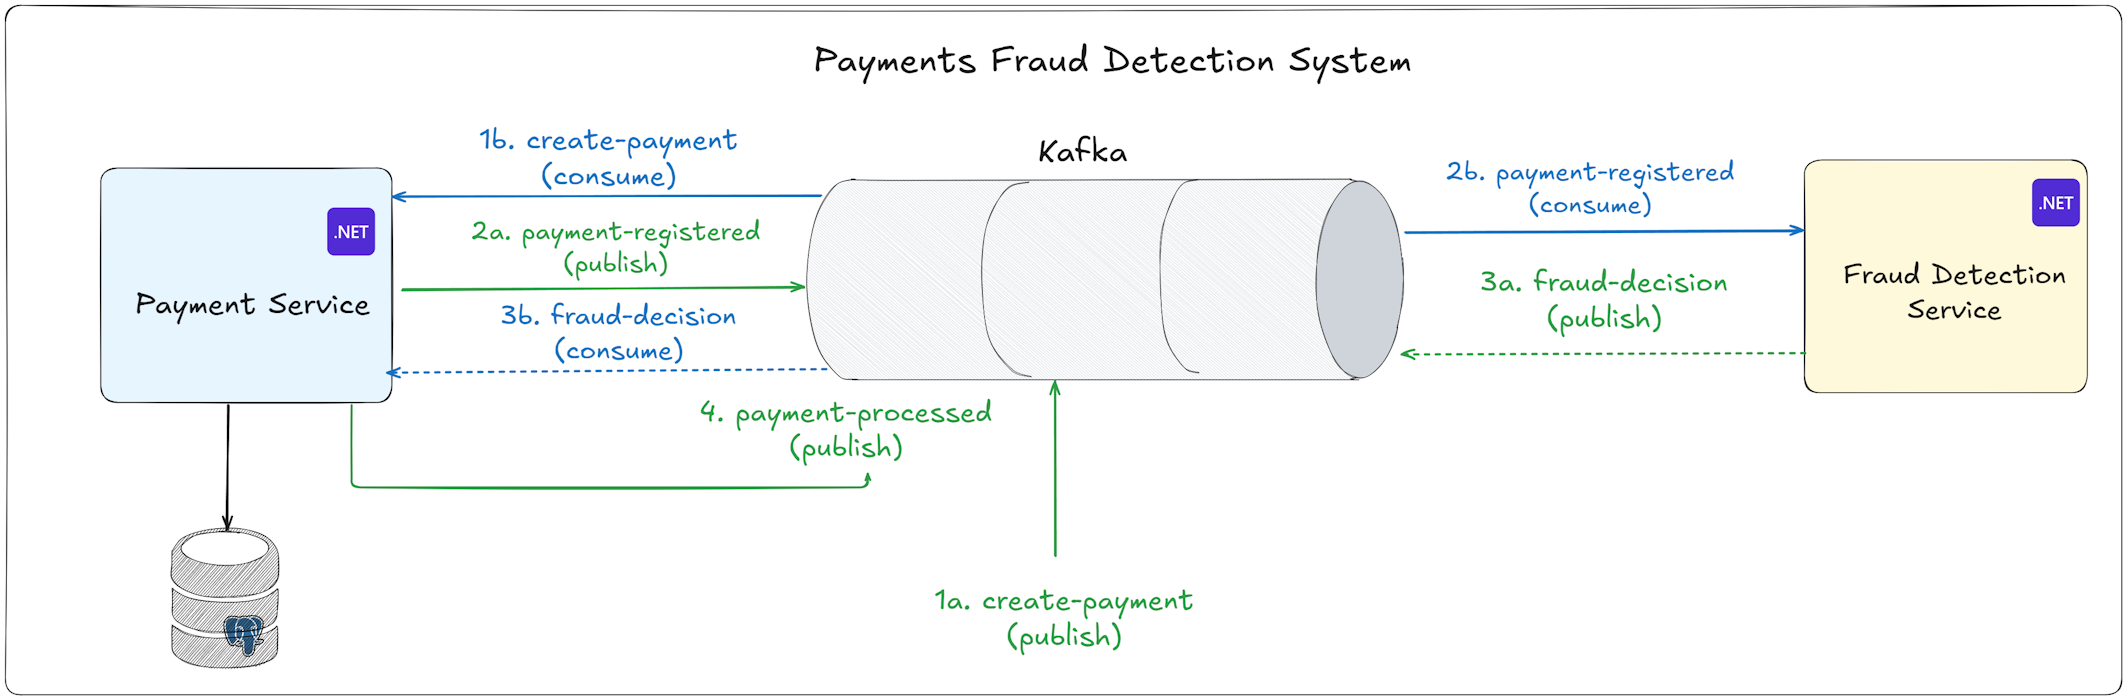
Step 1: Payment Creation Request
The flow starts when a CreatePaymentEvent is published to the create-payment Kafka topic.
Step 2: PaymentService Receives and Stores the Payment
The PaymentService has a background consumer listening to the create-payment topic.
When it receives an event, it does two things:
- Creates a payment record in its database with a status of "Processing".
- Publishes a
PaymentRegisteredEventto thepayment-registeredtopic.
Step 3: FraudDetectionService Analyzes the Payment
FraudDetectionService subscribes to the payment-registered topic.
The FraudDetectionService runs the payment through its fraud detection engine. This engine calculates a risk score based on multiple factors - high-risk countries, suspicious amounts, IP patterns, transaction timing, and card BIN reputation.
After analyzing the payment, it makes a decision: Allow, Review, or Block.
Then it publishes a FraudDecisionEvent to the fraud-decision topic.
Step 4: PaymentService Receives the Fraud Decision
The PaymentService has another background consumer listening to the fraud-decision topic.
When it receives a fraud decision, it updates the payment status in its database:
- "Allow" decision → Payment status becomes "Confirmed"
- "Review" decision → Payment status becomes "Reviewing"
- "Block" decision → Payment status becomes "Rejected"
After updating the status, it publishes a final PaymentProcessedEvent to the payment-processed topic.
Here is the complete event flow of the system:
CreatePaymentEvent → PaymentRegisteredEvent → FraudDecisionEvent → PaymentProcessedEvent
Here is the Kafka setup with UI in Docker:
ymlservices: kafka: image: apache/kafka:latest container_name: kafka restart: always ports: - "9094:9094" environment: KAFKA_NODE_ID: 1 KAFKA_PROCESS_ROLES: broker,controller KAFKA_LISTENERS: INTERNAL://kafka:9092,EXTERNAL://0.0.0.0:9094,CONTROLLER://kafka:9093 KAFKA_ADVERTISED_LISTENERS: INTERNAL://kafka:9092,EXTERNAL://localhost:9094 KAFKA_CONTROLLER_LISTENER_NAMES: CONTROLLER KAFKA_LISTENER_SECURITY_PROTOCOL_MAP: INTERNAL:PLAINTEXT,EXTERNAL:PLAINTEXT,CONTROLLER:PLAINTEXT KAFKA_INTER_BROKER_LISTENER_NAME: INTERNAL KAFKA_CONTROLLER_QUORUM_VOTERS: 1@kafka:9093 KAFKA_OFFSETS_TOPIC_REPLICATION_FACTOR: 1 KAFKA_TRANSACTION_STATE_LOG_REPLICATION_FACTOR: 1 KAFKA_TRANSACTION_STATE_LOG_MIN_ISR: 1 KAFKA_GROUP_INITIAL_REBALANCE_DELAY_MS: 0 volumes: - ./kafka-data:/var/lib/kafka/data networks: - docker-web kafka-ui: image: provectuslabs/kafka-ui:latest container_name: kafka-ui restart: always ports: - "8080:8080" environment: - KAFKA_CLUSTERS_0_NAME=local - KAFKA_CLUSTERS_0_BOOTSTRAPSERVERS=kafka:9092 depends_on: - kafka networks: - docker-web volumes: kafka_data: driver: local networks: docker-web: driver: bridge
Now let's explore how we can test this pipeline using NBomber.
How to Use NBomber for Kafka Load Testing
To create load tests, you need to define a scenario. A scenario represents some user behaviour you need to test.
If you're new to NBomber, I recommend you reading my Getting Started Article.
The first thing you need to understand about load testing Kafka-based systems is that you're not testing a request-response API.
You're testing an asynchronous message flow where producers and consumers operate independently.
You don't need to combine everything into one test scenario: publish a message, wait for the response, and measure the time. This doesn't work.
It doesn't reflect how your system actually behaves in production, and it gives you misleading performance numbers.
You need two separate scenarios running concurrently - one that simulates producers publishing messages, and another that simulates consumers reading messages. This separation is critical because in production, your producers and consumers are not synchronized.
Producers keep publishing regardless of how fast consumers can keep up, and consumers keep polling regardless of how fast producers are sending.
Here is how to set this up in NBomber:
csharpvar fraudDetectionScenario = new FraudDetectionScenario(); var publishScenario = fraudDetectionScenario.CreatePublishScenario("localhost:9094"); var consumeScenario = fraudDetectionScenario.CreateConsumeScenario("localhost:9094"); NBomberRunner .RegisterScenarios(publishScenario, consumeScenario) .Run(args);
Notice how I register both scenarios and run them together.
NBomber executes them concurrently, which means while one set of virtual users is publishing payment events, another set is consuming processed payment events. This simulates real production traffic.
This is the recommended way to test Event-Driven systems by NBomber docs. They show examples with MQTT, but the same principles apply to Kafka.
There are two ways of load testing microservices:
- End-to-End Load Tests Across the Pipeline
- Test Individual Microservices in Isolation
Let's explore how to test FraudDetectionService in isolation first.
The Producer Scenario
The producer scenario simulates a payment-registered topic coming into the FraudDetectionService.
Each iteration creates a new payment-registered event, adds a timestamp header for latency tracking, and publishes it to Kafka:
csharppublic ScenarioProps CreateProducerScenario(string kafkaBootstrapServers) { var producerConfig = new ProducerConfig { BootstrapServers = kafkaBootstrapServers, Acks = Acks.All, EnableIdempotence = true, LingerMs = 5, CompressionType = CompressionType.Lz4, BatchSize = 128 * 1024 }; var producer = new ProducerBuilder<string, string>(producerConfig).Build(); var scenario = Scenario.Create("fraud_detection_publish_scenario", async context => { var transactionId = Guid.NewGuid().ToString(); var timestamp = DateTimeOffset.UtcNow.ToUnixTimeMilliseconds(); var paymentRegisteredEvent = CreatePaymentRegisteredEvent(transactionId, context); var message = CreateKafkaMessage(paymentRegisteredEvent, timestamp, transactionId); var deliveryResult = await producer.ProduceAsync("payment-registered", message, context.ScenarioCancellationToken); return deliveryResult.Status == PersistenceStatus.Persisted ? Response.Ok() : Response.Fail(statusCode: "500", message: "Failed to persist message"); }) .WithClean(_ => { producer?.Dispose(); return Task.CompletedTask; }) .WithLoadSimulations( Simulation.KeepConstant(1, TimeSpan.FromSeconds(30)) ); return scenario; }
This scenario runs with one virtual user for 30 seconds, continuously publishing payment events.
The key insight here is passing a timestamp header to a Kafka message. I'll explain why this matters in a moment.
The Consumer Scenario
The consumer scenario simulates clients waiting for fraud decision results.
It polls the fraud-decision topic and measures how long it took to get the fraud decision result:
csharppublic ScenarioProps CreateConsumeScenario(string kafkaBootstrapServers) { var consumerConfig = new ConsumerConfig { BootstrapServers = kafkaBootstrapServers, GroupId = "nbomber-fraud-test", AutoOffsetReset = AutoOffsetReset.Latest, EnableAutoCommit = true, EnablePartitionEof = true }; var consumer = new ConsumerBuilder<string, string>(consumerConfig).Build(); consumer.Subscribe("fraud-decision"); var scenario = Scenario.Create("fraud_decision_consume_scenario", async context => { var consumeResult = consumer.Consume(TimeSpan.FromMilliseconds(100)); if (consumeResult?.Message is null) { return Response.Ok(statusCode: "204"); } var fraudDecisionEvent = JsonSerializer.Deserialize<FraudDecisionEvent>(consumeResult.Message.Value); if (fraudDecisionEvent == null) { return Response.Fail(statusCode: "400", message: "Failed to deserialize message"); } var timestampMs = ExtractTimestampFromHeaders(consumeResult); if (timestampMs <= 0) { return Response.Fail(statusCode: "500", payload: fraudDecisionEvent, customLatencyMs: 0); } var currentTimeMs = DateTimeOffset.UtcNow.ToUnixTimeMilliseconds(); var latency = currentTimeMs - timestampMs; return Response.Ok(payload: fraudDecisionEvent, customLatencyMs: latency); }) .WithClean(_ => { consumer.Close(); consumer.Dispose(); return Task.CompletedTask; }) .WithLoadSimulations( Simulation.KeepConstant(copies: 1, during: TimeSpan.FromSeconds(30)) ); return scenario; }
Tracking Message Delays Using Custom Kafka Headers
When we publish a payment event, we capture the current timestamp and add it to the message headers:
csharpprivate static Message<string, string> CreateKafkaMessage(CreatePaymentEvent paymentRegisteredEvent, long timestamp, string transactionId) { var messageValue = JsonSerializer.Serialize(paymentRegisteredEvent); var timestampBytes = JsonSerializer.SerializeToUtf8Bytes(new TimestampContainer(timestamp)); var message = new Message<string, string> { Key = transactionId, Value = messageValue, Headers = new Headers { { "timestamp", timestampBytes } } }; return message; }
This header is propagated through the entire pipeline. On the consumer side, we extract the timestamp and calculate the latency:
csharpvar consumeResult = consumer.Consume(TimeSpan.FromMilliseconds(100)); var timestampMs = ExtractTimestampFromHeaders(consumeResult); if (timestampMs <= 0) { return Response.Fail(statusCode: "500", payload: fraudDecisionEvent, customLatencyMs: 0); } var currentTimeMs = DateTimeOffset.UtcNow.ToUnixTimeMilliseconds(); var latency = currentTimeMs - timestampMs; return Response.Ok(payload: paymentProcessedEvent, customLatencyMs: latency);
The ExtractTimestampFromHeaders method is straightforward:
csharpprivate static long ExtractTimestampFromHeaders(ConsumeResult<string, string> consumeResult) { var timestampHeader = consumeResult.Message.Headers.FirstOrDefault(h => h.Key == "timestamp"); if (timestampHeader is null) { return 0; } return JsonSerializer.Deserialize<TimestampContainer>(timestampHeader.GetValueBytes())?.UnixTimeMilliseconds ?? 0; }
We are passing the latency value to NBomber's Response using the customLatencyMs parameter. This is crucial.
NBomber's default latency measurement only tracks how long your scenario step takes — in this case, how long the consumer.Consume() runs, which is typically just a few milliseconds.
But what we really care about is the end-to-end latency of the event flow.
NBomber then gives us statistics on this custom latency: min, max, mean, and percentiles (p50, p75, p95, p99). This is exactly what we need to understand the real performance of our system.
When we introduce changes to the FraudDetection algorithm, we can rerun the load tests to determine if the performance has changed and if it remains within the SLA.
Note: we are using WithClean for the producer and consumer.
This is important because they hold persistent connections that need proper cleanup.
Now let's run the tests and see how they perform:
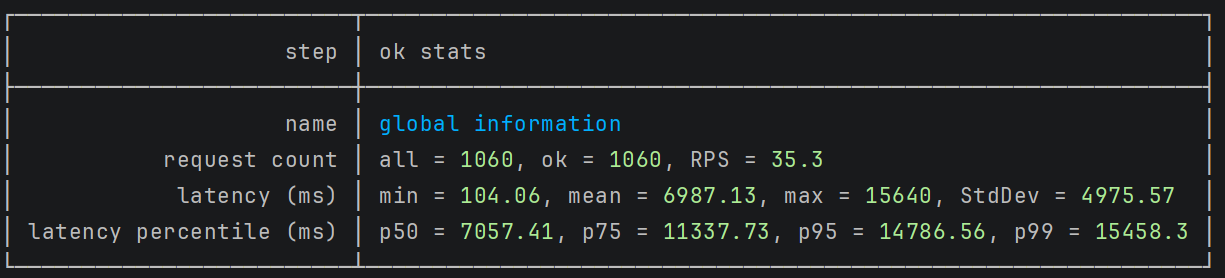
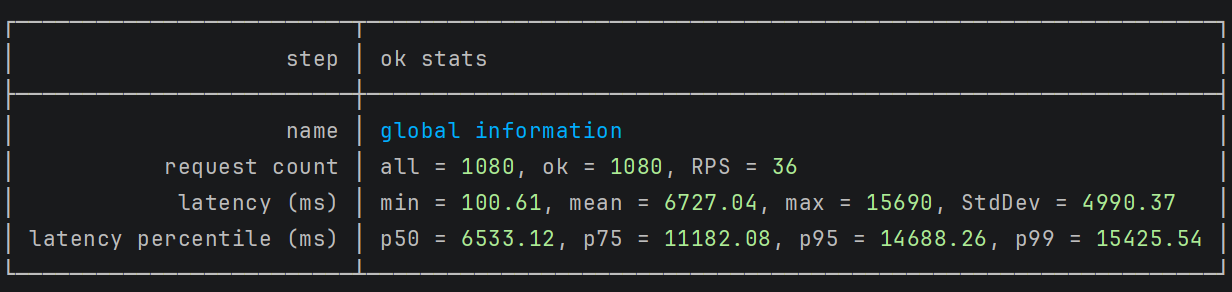
The results revealed a significant performance issue.
The FraudDetectionService achieved 35 requests per second (RPS) with 1 publisher and 2 consumers.
While the throughput seemed reasonable, the latency tells a different story: response times range from 100ms (min) to 15 seconds (p99). This wide latency spread indicates a critical bottleneck.
The problem is clear: the FraudDetectionService cannot consume messages fast enough to keep pace with incoming events.
As the producer publishes messages, they queue up in Kafka faster than the service can process them.
This creates a growing backlog, and messages at the back of the queue wait longer to be processed.
This is a common challenge in Kafka-based systems. When consumer throughput falls behind producer throughput, latency increases exponentially for messages waiting in the queue.
Here is a typical implementation of a consumer BackgroundService:
csharppublic class PaymentRegisteredConsumerService(IKafkaProducer kafkaProducer) : BackgroundService { protected override async Task ExecuteAsync(CancellationToken stoppingToken) { await Task.Run(() => StartConsumerLoop(stoppingToken), stoppingToken); } private async Task StartConsumerLoop(CancellationToken cancellationToken) { var config = new ConsumerConfig { ... }; using var consumer = new ConsumerBuilder<string, string>(config).Build(); consumer.Subscribe("payment-registered"); while (!cancellationToken.IsCancellationRequested) { await consumer.ConsumeWithInstrumentation(async (result, token) => { if (result is not null) { await ProcessPaymentRegisteredAsync(result, token); } }, cancellationToken: cancellationToken); } consumer.Close(); } }
Before adding more service instances, we can scale horizontally within a single service by running multiple background workers:
csharpprotected override async Task ExecuteAsync(CancellationToken stoppingToken) { const int maxNumberOfWorkers = 10; var tasks = Enumerable.Range(0, maxNumberOfWorkers) .Select(_ => Task.Run(() => StartConsumerLoop(stoppingToken), stoppingToken)) .ToArray(); await Task.WhenAll(tasks); }
This change creates 10 independent consumer loops within the same service instance. Each worker runs on its own thread and processes messages in parallel. This can increase throughput by up to 10x without deploying additional infrastructure.
To maximize the effectiveness of multiple workers, we need to increase the number of partitions in our Kafka topics. Kafka assigns each partition to only one consumer within a consumer group.
If we have 10 workers but only 1 partition, 9 workers will sit idle.
By increasing the payment-registered topic to 10 partitions, we allow all 10 workers to process messages simultaneously:
bashdocker exec -it kafka /opt/kafka/bin/kafka-topics.sh --bootstrap-server kafka:9092 --create --if-not-exists --topic payment-registered --partitions 10 --replication-factor 1
Let's rerun the tests and see how they perform.
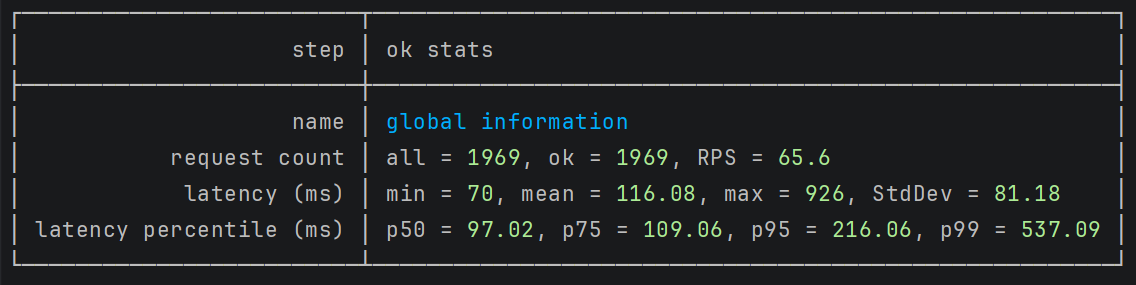
Before optimization:
After optimization:
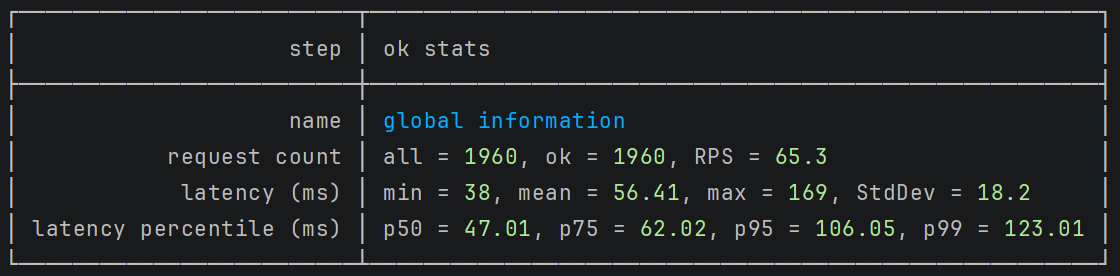
After making these two optimizations, the performance improved dramatically. The latency min is 38ms and p99 is 123ms.
End-to-End Load Tests Across the Pipeline
Let's explore how to test the complete end-to-end flow. This is where everything comes together - producers publishing payment requests, the entire fraud detection pipeline processing them, and consumers measuring how long the whole journey takes.
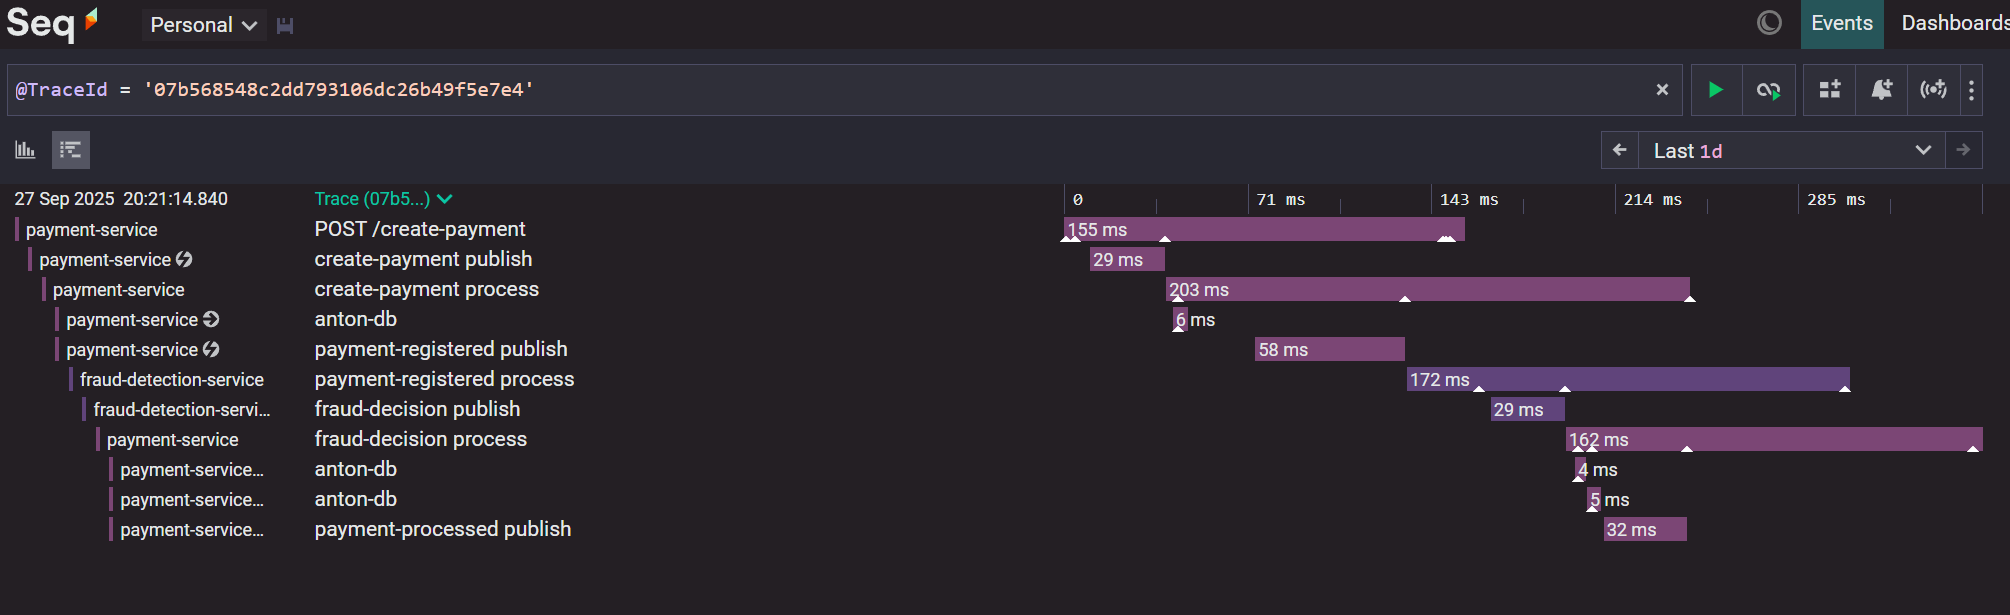
The payment processing pipeline consists of four events that flow through multiple services:
CreatePaymentEvent → PaymentRegisteredEvent → FraudDecisionEvent → PaymentProcessedEvent
Here are the distributed traces for the event pipeline:
The PaymentProcessingScenario creates two independent test scenarios - one for producers and one for consumers - that run simultaneously:
csharpvar paymentProcessingScenario = new PaymentProcessingScenario(); var publishScenario = paymentProcessingScenario.CreateProducerScenario("localhost:9094"); var consumeScenario = paymentProcessingScenario.CreateConsumeScenario("localhost:9094"); NBomberRunner .RegisterScenarios(publishScenario, consumeScenario) .Run(args);
The producer scenario simulates real payment traffic by publishing create-payment events at a constant rate of 1 virtual user for 30 seconds.
This creates a steady stream of payments entering the system.
The consumer scenario listens to the payment-processed topic and measures how long each payment took to complete the entire pipeline:
csharppublic class PaymentProcessingScenario { private readonly ConcurrentDictionary<string, IConsumer<string, string>> _consumers = new(); public ScenarioProps CreateProducerScenario(string kafkaBootstrapServers) { ... } public ScenarioProps CreateConsumeScenario(string kafkaBootstrapServers) { var consumerConfig = new ConsumerConfig { BootstrapServers = kafkaBootstrapServers, GroupId = "nbomber-load-test", AutoOffsetReset = AutoOffsetReset.Latest, EnableAutoCommit = true, EnablePartitionEof = false }; var scenario = Scenario.Create("payment_consume_scenario", async context => { var consumer = GetOrAddConsumer(context, consumerConfig); var consumeResult = consumer.Consume(TimeSpan.FromMilliseconds(100)); if (consumeResult?.Message is null) { return Response.Ok(statusCode: "204", customLatencyMs: 0); } var paymentProcessedEvent = JsonSerializer.Deserialize<PaymentProcessedEvent>(consumeResult.Message.Value); if (paymentProcessedEvent is null) { return Response.Fail(statusCode: "400", message: "Failed to deserialize message"); } var timestampMs = ExtractTimestampFromHeaders(consumeResult); if (timestampMs <= 0) { return Response.Fail(statusCode: "500", payload: paymentProcessedEvent, customLatencyMs: 0); } var currentTimeMs = DateTimeOffset.UtcNow.ToUnixTimeMilliseconds(); var latency = currentTimeMs - timestampMs; context.Logger.Debug("Transaction {TransactionId}: timestamp={Timestamp}, current={Current}, latency={Latency}ms", paymentProcessedEvent.TransactionId, timestampMs, currentTimeMs, latency); return Response.Ok(payload: paymentProcessedEvent, customLatencyMs: latency); }) .WithClean(_ => { foreach (var consumer in _consumers) { consumer.Value.Close(); consumer.Value.Dispose(); } return Task.CompletedTask; }) .WithLoadSimulations( Simulation.KeepConstant(copies: 2, during: TimeSpan.FromSeconds(30)) ); return scenario; } private IConsumer<string, string> GetOrAddConsumer(IScenarioContext context, ConsumerConfig consumerConfig) { return _consumers.GetOrAdd(context.ScenarioInfo.InstanceId, _ => { var newConsumer = new ConsumerBuilder<string, string>(consumerConfig).Build(); newConsumer.Subscribe("fraud-decision"); context.Logger.Debug("Created consumer for thread {ThreadId}", context.ScenarioInfo.InstanceId); return newConsumer; }); } }
Here we are running 2 concurrent consumers.
There's an important technical detail when testing Kafka pipelines: Kafka consumer objects are not thread-safe according to Confluent's documentation. This means we cannot share a single consumer instance across multiple test threads.
To solve this, I use the GetOrAddConsumer method with a ConcurrentDictionary.
This pattern creates one unique consumer per test thread, identified by context.ScenarioInfo.InstanceId.
Each virtual user gets its own consumer instance, ensuring thread-safe operation during concurrent testing.
Let's run the tests and explore the results:
The initial test revealed performance issues similar to those in the isolated Fraud Detection scenario. The system struggled to process payments quickly enough.
Let's increase the number of background workers to 5:
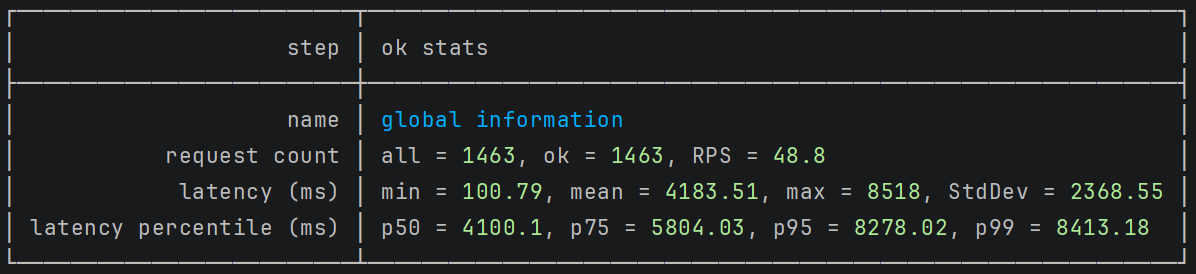
After increasing the number of background workers to 5, performance improved significantly. The longest iteration dropped to 8 seconds - a 2x improvement to the previous test.
Let's try with 10 background workers and 10 partitions configured for each Kafka topic:
The results improved dramatically. The longest iteration now completes in just 500ms - a 16x improvement from the first test.
Next, let's increase the number of consumer virtual users in the load test:
csharp.WithLoadSimulations( Simulation.KeepConstant(copies: 5, during: TimeSpan.FromSeconds(30)) );
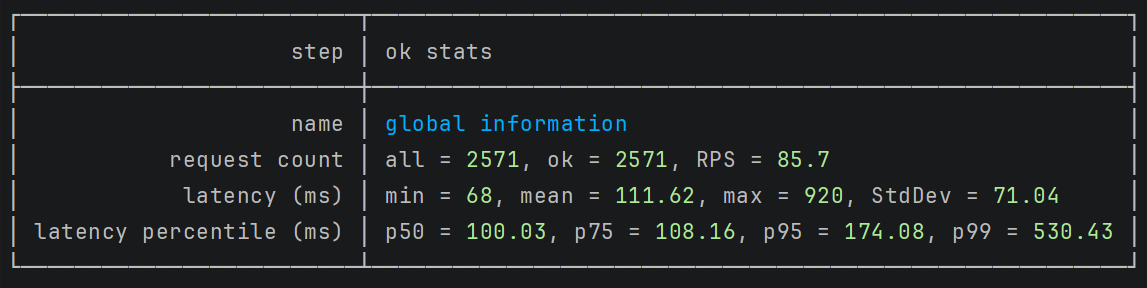
The latency remained consistent, but throughput increased. We're now processing more payments per second with the exact response times.
When load testing Kafka pipelines, three factors must work together to produce realistic results:
- Background Workers: The number of service instances processing messages
- Kafka Partitions: The number of partitions available for parallel processing
- Virtual Consumers: The number of simulated clients in your load test
You need to balance these three elements. Too few workers or partitions create bottlenecks.
Too many virtual consumers without enough workers causes delays. Finding the right balance gives you accurate performance data that reflects real production behavior.
Custom Metrics You Should Track
NBomber gives you great out-of-the-box metrics - throughput, latency percentiles, error rates.
But when you're load testing a fraud detection pipeline, you need domain-specific metrics that tell you what's actually happening inside your system.
NBomber allows you to create custom metrics for business or technical KPIs.
Two common types are:
- Counter – tracks a running total (e.g., total successful logins).
- Gauge – tracks the latest value (e.g., current memory usage).
Counter: Tracking Fraud Detection Decisions
The most critical metric in the fraud detection pipeline is the distribution of decisions: how many payments were allowed, how many were flagged for review, and how many were rejected.
Here's how we define the counters:
Let's explore how we can track Fraud Detection decisions.
Inside the consumer scenario, after deserializing the payment-processed event, I check the status:
csharppublic ScenarioProps CreateConsumeScenario(string kafkaBootstrapServers) { var confirmedCounter = Metric.CreateCounter("payments-confirmed", unitOfMeasure: "payments"); var reviewingCounter = Metric.CreateCounter("payments-reviewing", unitOfMeasure: "payments"); var rejectedCounter = Metric.CreateCounter("payments-rejected", unitOfMeasure: "payments"); // ... var scenario = Scenario.Create("payment_consume_scenario", async context => { // ... var paymentProcessedEvent = JsonSerializer.Deserialize<PaymentProcessedEvent>(consumeResult.Message.Value); switch (paymentProcessedEvent.Status) { case "Confirmed": confirmedCounter.Add(1); break; case "Reviewing": reviewingCounter.Add(1); break; case "Rejected": rejectedCounter.Add(1); break; } // ... }) .WithInit(context => { context.RegisterMetric(confirmedCounter); context.RegisterMetric(reviewingCounter); context.RegisterMetric(rejectedCounter); WarmUpConsumer(consumer, context); return Task.CompletedTask; }) .WithClean(...) .WithLoadSimulations(...); return scenario; }
The key is registering these metrics in the WithInit method using context.RegisterMetric().
This tells NBomber to track these counters and include them in the final report.
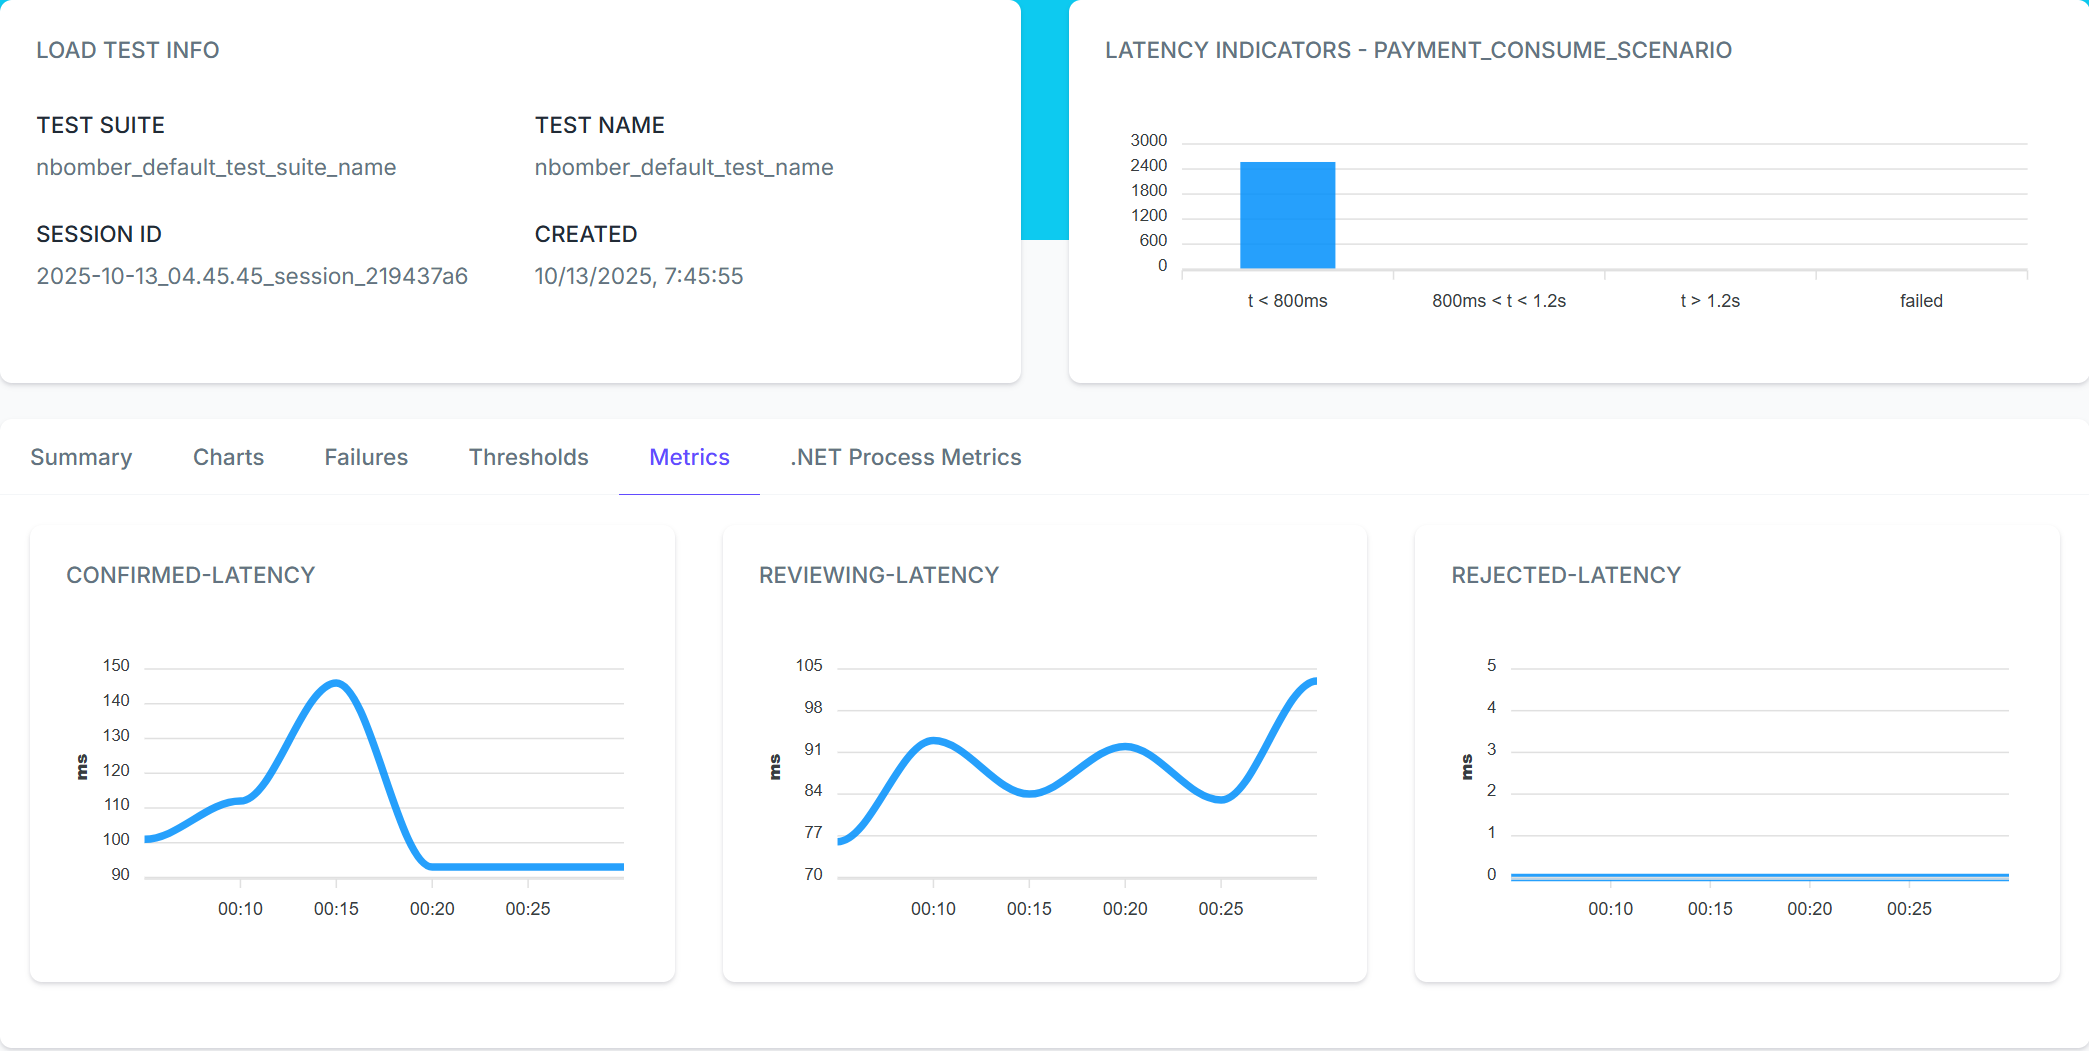
Gauge: Measuring Processing Time by Decision Type
Not all payments take the same time to process. Payments that get blocked quickly might have lower latency than payments that need complex fraud analysis. We can measure this using gauges:
csharppublic ScenarioProps CreateConsumeScenario(string kafkaBootstrapServers) { var confirmedLatencyGauge = Metric.CreateGauge("confirmed-latency", unitOfMeasure: "ms"); var reviewingLatencyGauge = Metric.CreateGauge("reviewing-latency", unitOfMeasure: "ms"); var rejectedLatencyGauge = Metric.CreateGauge("rejected-latency", unitOfMeasure: "ms"); var scenario = Scenario.Create("payment_consume_scenario", async context => { // ... var timestampMs = ExtractTimestampFromHeaders(consumeResult); var currentTimeMs = DateTimeOffset.UtcNow.ToUnixTimeMilliseconds(); var latency = currentTimeMs - timestampMs; switch (paymentProcessedEvent.Status) { case "Confirmed": confirmedLatencyGauge.Set(latency); break; case "Reviewing": reviewingLatencyGauge.Set(latency); break; case "Rejected": rejectedLatencyGauge.Set(latency); break; } return Response.Ok( payload: paymentProcessedEvent, sizeBytes: consumeResult.Message.Value.Length, customLatencyMs: latency ); }) .WithInit(context => { context.RegisterMetric(confirmedLatencyGauge); context.RegisterMetric(reviewingLatencyGauge); context.RegisterMetric(rejectedLatencyGauge); WarmUpConsumer(consumer, context); return Task.CompletedTask; }) .WithClean(...) .WithLoadSimulations(...); }
Each time we process a message, we calculate the end-to-end latency and set the appropriate gauge based on the payment status.
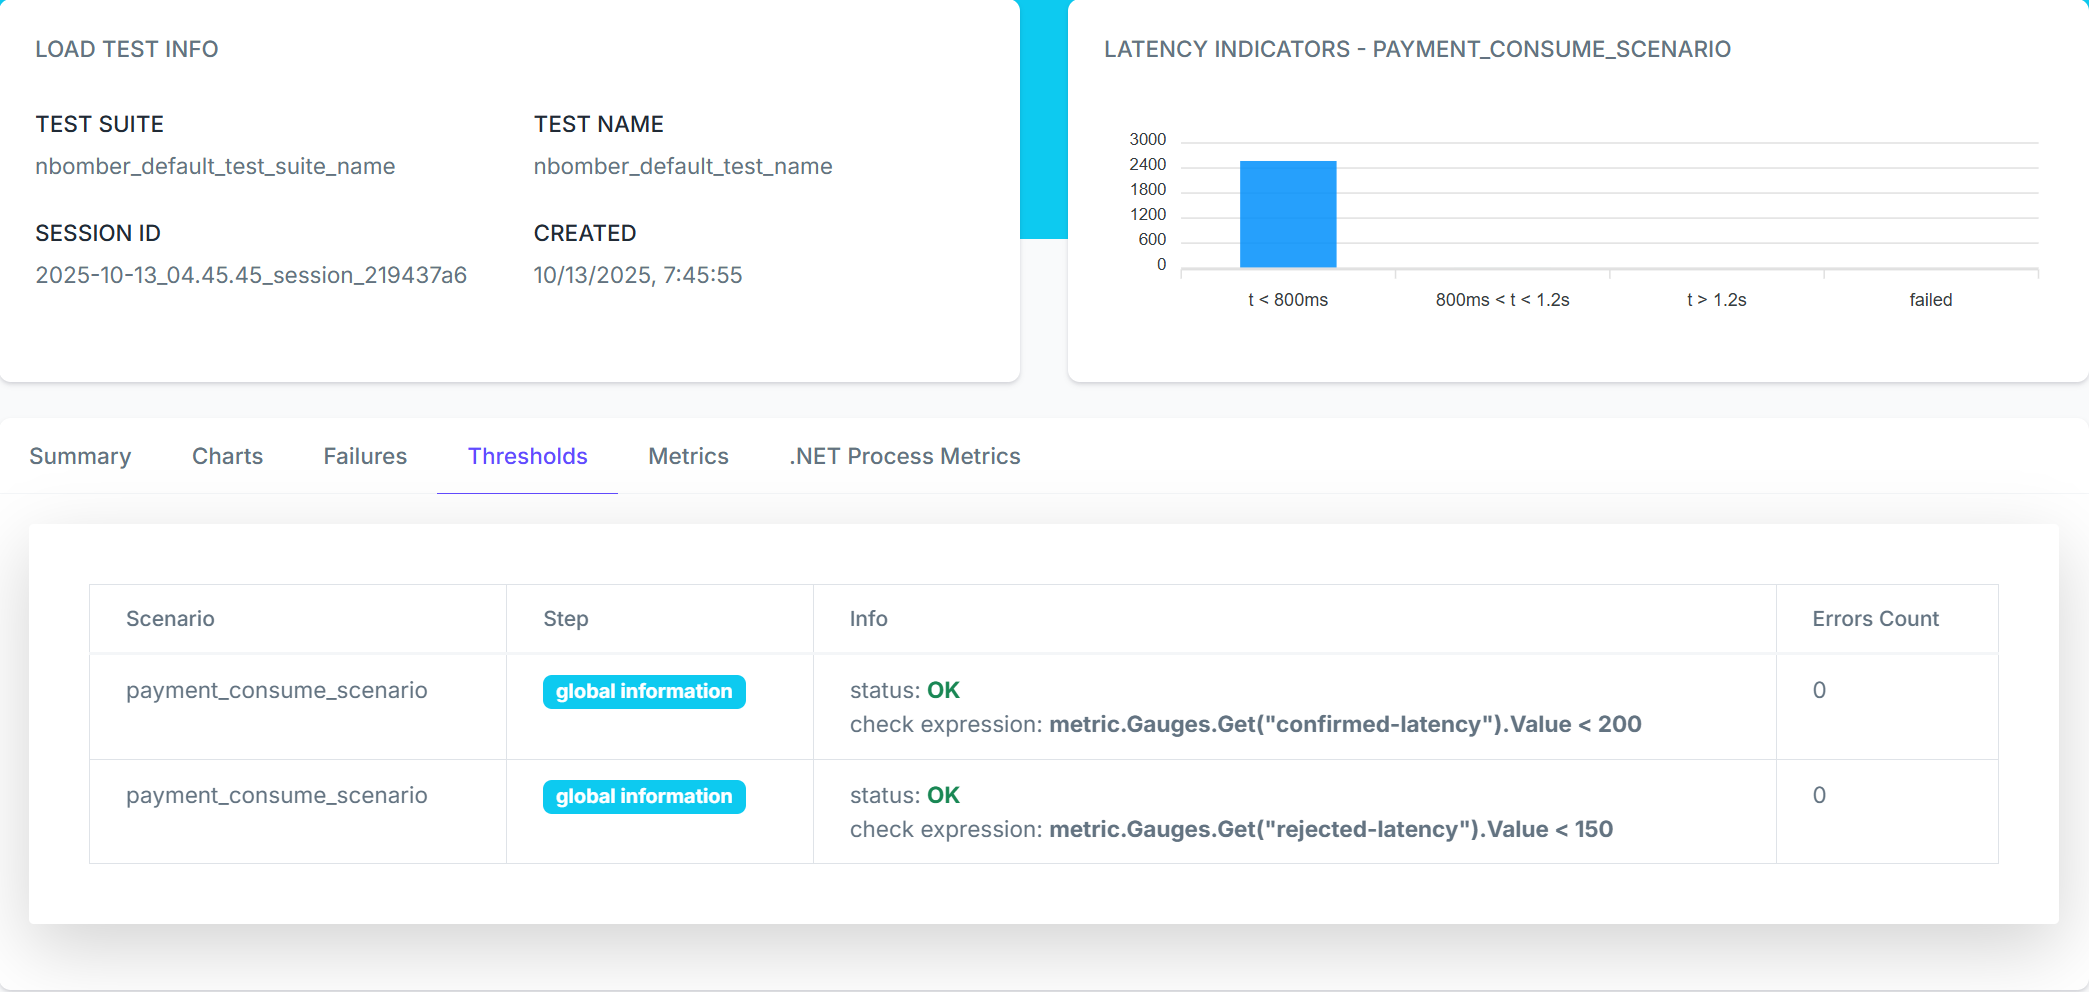
Using Thresholds to Validate Performance
NBomber allows defining thresholds on these custom metrics to ensure the system meets performance standards. Here's how to add thresholds to validate the fraud detection behavior:
csharpvar scenario = Scenario.Create("payment_consume_scenario", async context => { // ... }) .WithInit(context => { context.RegisterMetric(confirmedLatencyGauge); context.RegisterMetric(reviewingLatencyGauge); context.RegisterMetric(rejectedLatencyGauge); WarmUpConsumer(consumer, context); return Task.CompletedTask; }) .WithThresholds( // Ensure confirmed payment latency stays under 200ms Threshold.Create(metric => metric.Gauges.Get("confirmed-latency").Value < 200), // Ensure rejected payment latency is fast (under 150ms) Threshold.Create(metric => metric.Gauges.Get("rejected-latency").Value < 150) );
When we run the test, NBomber automatically evaluates these thresholds. If any threshold fails, the test is marked as failed, and we can see exactly which condition wasn't met.
Summary
NBomber lets you test Kafka pipelines using plain C# or F# with the same code you already use for your microservices.
Testing Kafka pipelines the right way means running producers and consumers separately, just like in production.
NBomber makes this easy — you create two scenarios and run them concurrently. One publishes payment events while the other consumes fraud decisions. This reveals real performance issues: slow consumers, wrong number of partitions and latency spikes under load.
You can track custom business metrics like approval rates, measure the true end-to-end latency of the Kafka pipelines, and spot bottlenecks before production.
With NBomber, you get actionable insights fast. Built-in HTML reports show throughput, latency percentiles, and error rates. You can set thresholds to fail tests automatically if performance drops.
NBomber is free for personal use. Using NBomber in an organization requires a paid license, learn more here.
NBomber's pricing is very affordable because the license covers the entire organization. A single license can be shared across all teams, so there's no need to manage individual developer seats — one license works for the whole company.
You can check the Pricing info here.
Start building your load tests today with NBomber and find issues before they reach production:
- I highly recommend starting with the Load Testing Microservices. It will provide a basic foundation on how to cover your system with isolated and end-to-end (E2E) Load testing.
- After that, you're ready to explore their collection of demo examples
Many thanks to NBomber for sponsoring this blog post.
Hope you find this newsletter useful. See you next time.
