
"EF Core is slow, don't use it."
I heard this from so many developers.
And almost every time, the cause is the same: EF Core makes it very easy to write a query that loads far more data than you need, and then you blame it for speed.
Integration tests don't catch this.
In development, your queries complete in a few milliseconds for a database with a few hundred rows. Then production grows to 2 million rows and the same endpoint takes 30 seconds.
I've spent a lot of time optimizing EF Core in production systems, and I know a set of techniques that work.
Some of them you need to apply daily, others - when you need to make it faster, or based on your specific datasets.
Let's dive in.
P.S.: EF Core can be really slow when inserting data.
Depending on how many rows you insert and columns you have, it can take 5, 10 seconds, or even a minute.
This amazing library offers the best performance for bulk write operations in the market. See it below.
Step 0: Measure Before You Optimize
All examples in this article use a shipment tracking domain:
csharppublic class Shipment { public Guid Id { get; set; } public string Number { get; set; } public string OrderId { get; set; } public string Carrier { get; set; } public string ReceiverEmail { get; set; } public ShipmentStatus Status { get; set; } public DateTime CreatedAt { get; set; } public DateTime? UpdatedAt { get; set; } public Address Address { get; set; } public List<ShipmentItem> Items { get; set; } } public class ShipmentItem { public Guid Id { get; set; } public string Name { get; set; } public int Quantity { get; set; } public Guid ShipmentId { get; set; } public Shipment Shipment { get; set; } }
Note: all queries were tested on PostgreSQL. The same ideas apply to SQL Server, MySQL, and Oracle, though the generated SQL and the exact limits differ.
Most performance work goes wrong before a single line of code changes.
A query feels slow, someone puts a cache in front of it, and the endpoint gets faster.
The slow query is still there. It just runs less often, and it will hurt again the moment the cache misses or the data changes more frequently than you expected.
So the first step is finding out what SQL your LINQ actually produces.
Turn on query logging in development:
csharpbuilder.Services.AddDbContext<ShipmentsDbContext>(options => { options.UseNpgsql(connectionString); if (builder.Environment.IsDevelopment()) { options.LogTo(Console.WriteLine, LogLevel.Information) .EnableSensitiveDataLogging() .EnableDetailedErrors(); } });
LogTo writes every generated SQL statement to the console.
EnableSensitiveDataLogging includes the actual parameter values, so you can copy the statement straight into your database client and run it.
You can also enable EF Core logging through your logging configuration - set the Microsoft.EntityFrameworkCore.Database.Command category to Information and let your logging framework (Serilog, NLog) write the SQL to a file or a sink of your choice.
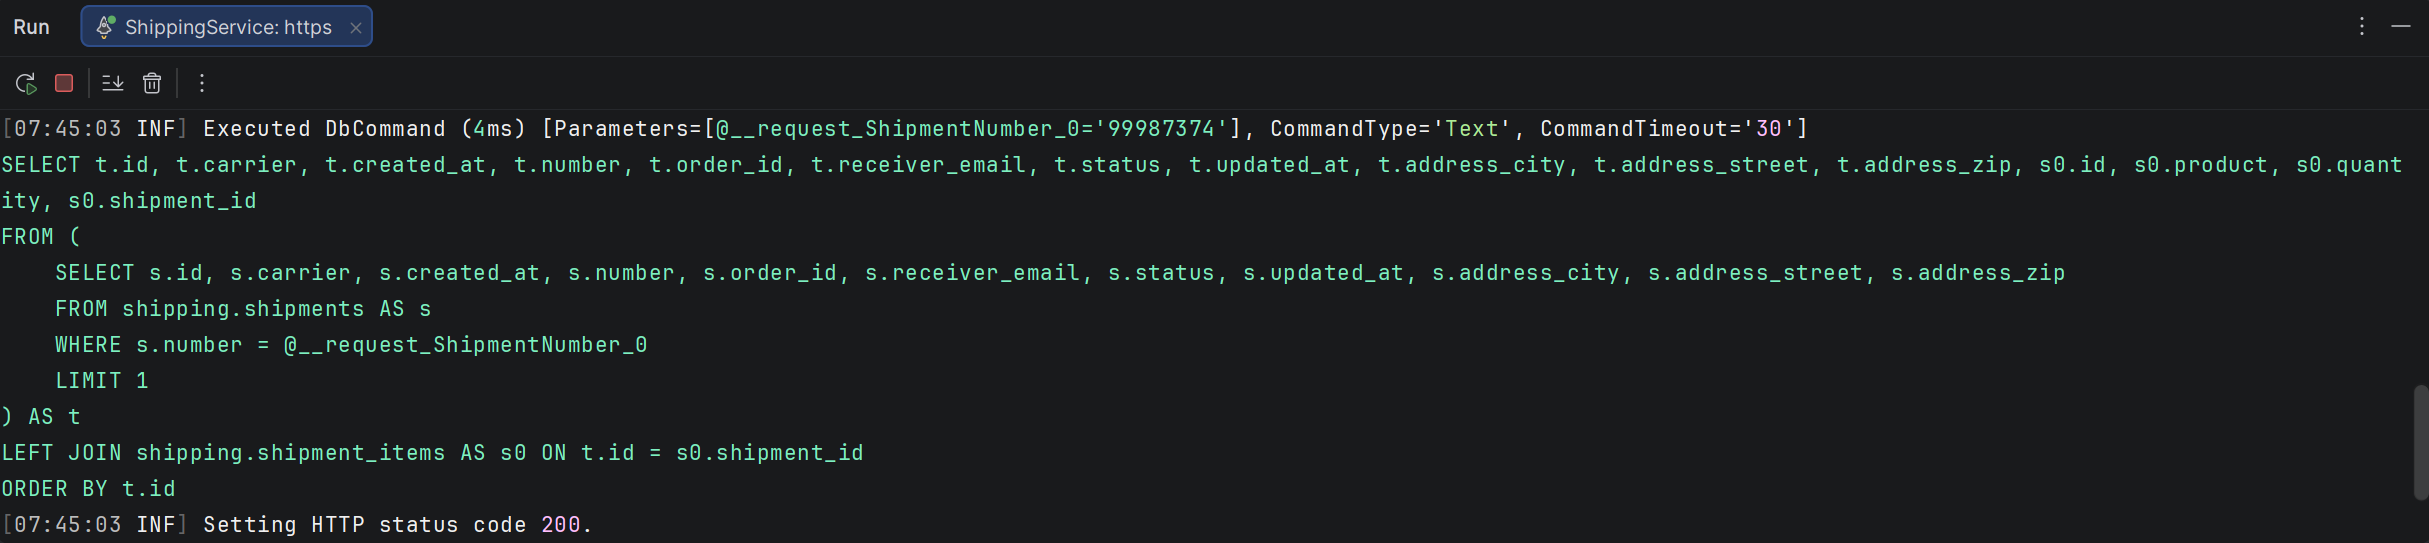
Note: never enable
EnableSensitiveDataLoggingin production. It writes parameter values, including emails, addresses, and anything else your queries filter on.
Once you have the SQL, run it with an execution plan (EXPLAIN ANALYZE in PostgreSQL, or the actual execution plan in SQL Server).
The plan tells you whether the database is scanning an entire table or using an index, and where the time is actually spent.
Let's explore the query plan for this small query (from the screenshot above) that finds a Shipment by a number:
csharpvar shipment = await context.Shipments .Include(x => x.Items) .Where(s => s.Number == shipmentNumber) .FirstOrDefaultAsync(cancellationToken);
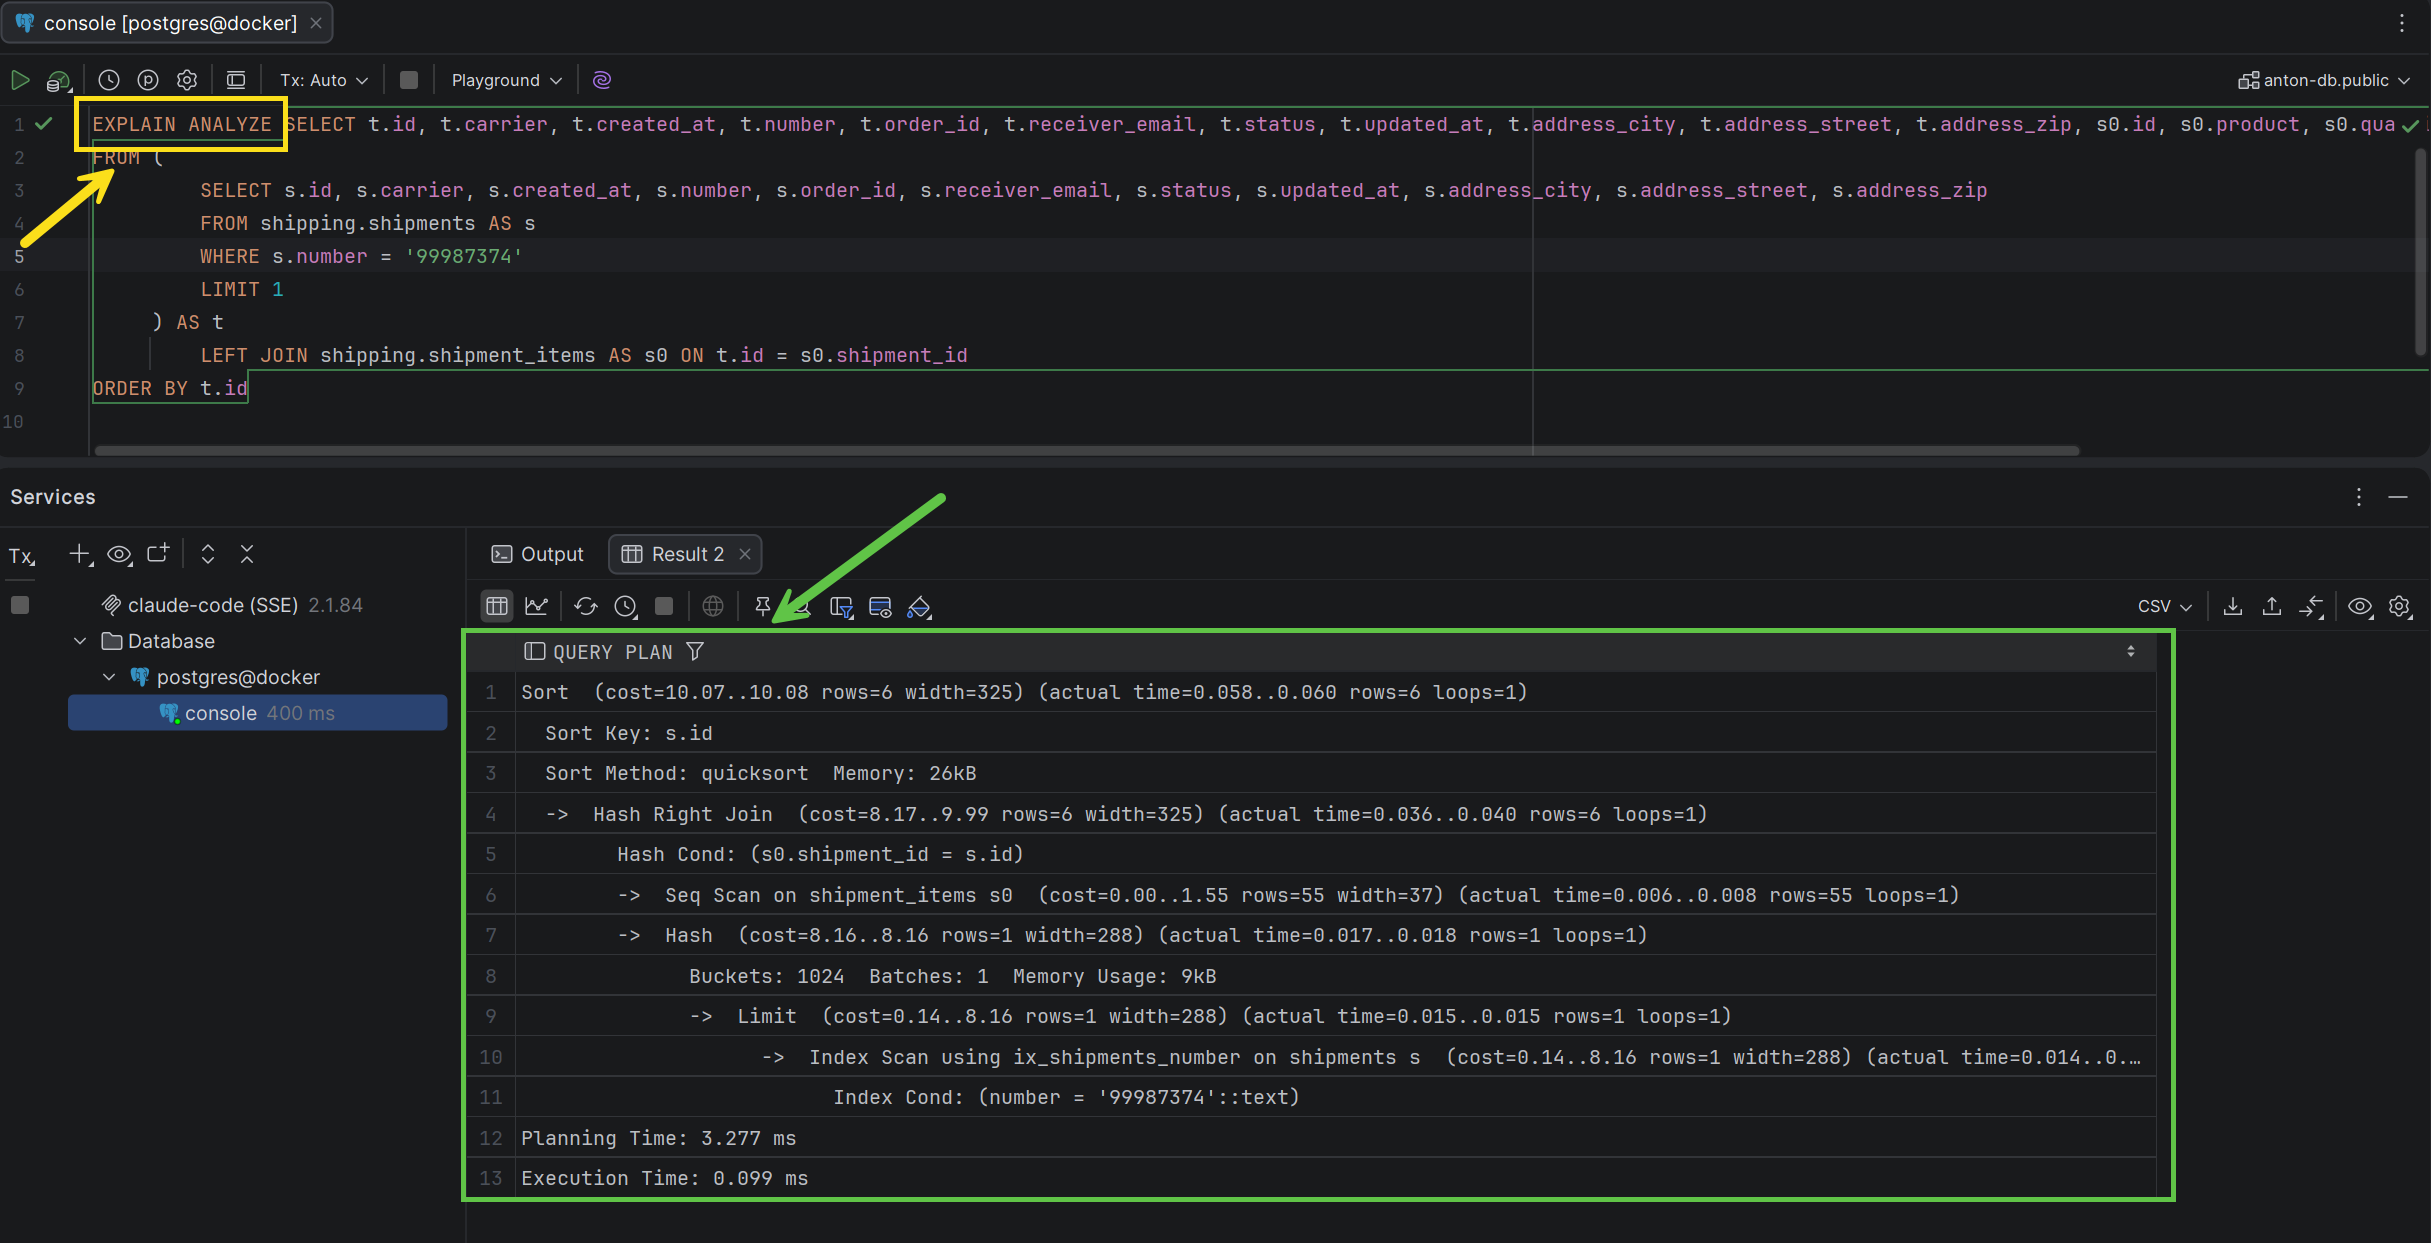
Three numbers are worth checking every time:
- Does the database use a full table scan or an index?
- How many rows the database returns. If a query returns 50,000 rows to build a page of 100, the fix is in your LINQ in EF Core query.
- How many round-trips your code makes. One request per loop iteration is a different problem from one slow request.
For anything you plan to tune repeatedly, write a benchmark with BenchmarkDotNet so you have a number to compare against.
Now that you can see what's actually happening, let's explore ways we can improve performance.
Fetch Less Data
Almost every slow EF Core query is slow for the same reason: it moves more data out of the database than the code needs.
The three optimizations in this step all attack that.
1. Add the Right Indexes
In EF Core (migrations), it automatically creates indexes for primary keys and foreign keys. It doesn't create indexes for the columns you filter and sort on.
If your shipment list screen filters by status and orders by creation date, the database has to scan the table on every request:
Add the index in your entity configuration (the database migration will create it):
csharppublic class ShipmentConfiguration : IEntityTypeConfiguration<Shipment> { public void Configure(EntityTypeBuilder<Shipment> builder) { builder.HasKey(x => x.Id); builder.HasIndex(x => x.Number) .IsUnique(); builder.HasIndex(x => new { x.Status, x.CreatedAt }); } }
The composite index on (Status, CreatedAt) matches the shape of the query.
Column order matters here. The database can use this index to filter by:
StatusaloneStatusand then sort byCreatedAt
But it can't use it to sort by CreatedAt alone.
Put the column you filter on for equality first, and the column you range-filter or sort on second.
When most of your queries only care about a small slice of the table, a filtered index is cheaper to maintain:
csharpbuilder.HasIndex(x => x.CreatedAt) .HasFilter("\"Status\" NOT IN (4, 5)");
This indexes only the shipments that are still in flight and skips the delivered and canceled rows, which make up most of the table over time.
Remember that indexes aren't free. Every index has to be updated on every insert, update, and delete that touches its columns. Add indexes only for the query shapes you actually run.
Indexes help the database find your rows quickly. The next step is making sure you ask for fewer of them.
2. Filter Early, in the Database
This is the mistake I see most often from young developers (sometimes AI does this, duh!), and it usually hides behind a helper method:
csharp// Loads every shipment in the table var shipments = await dbContext.Shipments.ToListAsync(cancellationToken); var pending = shipments .Where(s => s.Status == ShipmentStatus.Processing) .ToList();
The moment you call ToListAsync, the query is executed, and the rest happens in memory in your application.
The database sends every row over the network. EF Core materializes each row into an object. And then your code throws most of them away.
Keep the filter inside the IQueryable so it becomes a WHERE clause:
csharpvar pending = await dbContext.Shipments .Where(s => s.Status == ShipmentStatus.Processing && s.CreatedAt >= since) .ToListAsync(cancellationToken);
The same applies to sorting, grouping, and aggregation. Count(), Any(), Sum(), and Max() all translate to SQL when you call them on an IQueryable.
It all runs in memory when you call them after calling ToListAsync.
3. Project Only the Columns You Need
Loading a full entity means loading every column it maps to, including the ones your endpoint never returns.
If a Shipment has 10 columns and your list screen shows 4 of them, you're moving more than twice the data you need.
Project into a record or class instead:
csharppublic record ShipmentResponse( Guid Id, string Number, string Carrier, ShipmentStatus Status, DateTime CreatedAt); var shipments = await dbContext.Shipments .Where(s => s.Status == ShipmentStatus.Processing) .OrderByDescending(s => s.CreatedAt) .Select(s => new ShipmentResponse( s.Id, s.Number, s.Carrier, s.Status, s.CreatedAt)) .ToListAsync(cancellationToken);
EF Core translates the Select into a SELECT list with exactly those five columns.
Projections do three things at once:
- They cut the size of data the database reads
- They cut the size of data you transfer over the network from the database to your app
- They skip change tracking entirely, because there's no entity to track.
This is consistently the single biggest win available. Projecting only the required columns can take your query somewhat from 10 seconds to 40 milliseconds (when reading 10,000 or more rows).
You can explore the benchmarks in the optimization challenge I did before with EF Core.
Projections also compose well with aggregation:
csharpvar summaries = await dbContext.Shipments .Where(s => s.CreatedAt >= since) .Select(s => new ShipmentSummary( s.Number, s.Status, s.Items.Count, s.Items.Sum(i => i.Quantity))) .ToListAsync(cancellationToken);
The database computes the item count and quantity sum. No ShipmentItem objects are created in your application at all.
Load Your Data Correctly
You're now fetching the right rows and the right columns. The next step is how EF Core hands them to you.
4. Turn Off Change Tracking for Read-Only Queries
By default, EF Core tracks every entity a query returns.
It keeps a snapshot of the original values so it can work out what changed when you call SaveChanges.
That snapshot costs memory and CPU on every single row.
For a query that only reads data, all of that work is thrown away.
csharpvar shipments = await dbContext.Shipments .AsNoTracking() .Where(s => s.Status == ShipmentStatus.Delivered) .ToListAsync(cancellationToken);
AsNoTracking skips the snapshot and returns the entities directly.
When your query loads the same entity more than once, through a graph or a join, use AsNoTrackingWithIdentityResolution() instead.
It skips the change tracker but still returns one object per database row identity, so you don't get duplicate instances of the same shipment.
If most of your DbContext usage is reads (report module), flip the default and opt into tracking where you need it:
csharpoptions.UseNpgsql(connectionString) .UseQueryTrackingBehavior(QueryTrackingBehavior.NoTracking);
One thing worth knowing: if you already project into a record with Select, you don't need AsNoTracking.
There's nothing to track, and adding it changes nothing.
I go into more detail on how the change tracker works in Understanding Change Tracking for Better Performance in EF Core.
5. Use Eager Loading Deliberately
Include is how you load related entities in one round-trip. It's also how a small query turns into a large one.
csharpvar shipments = await dbContext.Shipments .Include(s => s.Items) .Where(s => s.Status == ShipmentStatus.Processing) .ToListAsync(cancellationToken);
This loads every column of every shipment and every column of every item.
If you only need the item names, project instead of including:
csharpvar shipments = await dbContext.Shipments .Where(s => s.Status == ShipmentStatus.Processing) .Select(s => new ShipmentWithItems( s.Number, s.Items.Select(i => i.Name).ToList())) .ToListAsync(cancellationToken);
When you genuinely need the entities, filter the include so you don't load the whole collection:
csharpvar shipments = await dbContext.Shipments .Include(s => s.Items.Where(i => i.Quantity > 0)) .ToListAsync(cancellationToken);
The bigger trap is lazy loading.
With lazy loading proxies enabled, accessing shipment.Items inside a loop issues a separate query per shipment.
A list of 500 shipments becomes 501 database round-trips, and nothing in your code makes that visible.
This is the N+1 problem, and it's the reason I don't enable lazy loading in production services.
Lazy loading is not recommended by Microsoft themselves. It only exists to make migration from old .NET Framework and Entity Framework 6 apps to new ASP .NET Core and EF Core apps easier.
Load what you need explicitly, and the query count stays something you can reason about.
6. Split Large Includes with AsSplitQuery
When you include two or more collections, EF Core joins them into a single result set.
A shipment with 10 items and 10 status events returns 100 rows, and every shipment column is repeated across all 100 rows. This is called a Cartesian explosion, and it grows by multiplication.
AsSplitQuery tells EF Core to issue one query per collection instead:
csharpvar shipments = await dbContext.Shipments .Include(s => s.Items) .Include(s => s.StatusEvents) .AsSplitQuery() .Where(s => s.CreatedAt >= since) .ToListAsync(cancellationToken);
Now you get three small result sets with no duplication instead of one large one.
Split query isn't always faster.
It trades one round-trip for several. When your collections are small or the query is already selective, the extra round trips cost more than the duplicated rows.
In my optimization challenge, adding AsSplitQuery made the query slower, moving it from 40 milliseconds to 51 milliseconds.
Measure it on your data before you add it.
Note: split query runs multiple statements, so the results aren't guaranteed to be consistent with each other unless you wrap them in a transaction. For most read scenarios, this is fine, but it matters if the data changes underneath very frequently.
Make Queries Scale With Your Data
A query that's fast on 10,000 rows can fall over at 10 million. These two optimizations are about the queries that degrade as your table grows.
7. Paginate with Cursor (Keyset) Instead of Offset
Offset pagination is the obvious approach and the one almost everyone starts with:
csharpvar page = await dbContext.Shipments .OrderByDescending(s => s.CreatedAt) .Skip(pageNumber * pageSize) .Take(pageSize) .ToListAsync(cancellationToken);
Skip translates to OFFSET, and OFFSET isn't free.
To return rows 100,000 to 100,020, the database has to walk the first 100,000 rows and discard them. Even when using an index, it still needs to walk the first 100,000 rows in the index.
The danger is that you get results pretty fast for the first 100 pages. But page 5,000 can become so slow.
You may say: "Who scrolls to page 5,000 on UI?" And the answer is: "Those who click to jump straight to the last page."
Cursor or Keyset pagination asks for rows after a known position instead:
csharpvar page = await dbContext.Shipments .Where(s => s.CreatedAt < lastCreatedAt || (s.CreatedAt == lastCreatedAt && s.Id < lastId)) .OrderByDescending(s => s.CreatedAt) .ThenByDescending(s => s.Id) .Take(pageSize) .ToListAsync(cancellationToken);
The database seeks straight to the position in the index and reads 20 rows. Page 5,000 costs the same as page 1.
The Id comparison is there to break ties.
If two shipments share a CreatedAt value, sorting by the timestamp alone isn't deterministic, and rows can be skipped or repeated across pages.
The trade-off is that you can't jump to a random page number, because each page needs the last row of the previous one. For infinite scroll-like "load more" or paging back/next, this is a perfect fit.
8. Watch the IN and Contains Parameter Limit
This one catches experienced developers, because the code looks completely reasonable:
csharpvar shipments = await dbContext.Shipments .Where(s => orderIds.Contains(s.OrderId)) .ToListAsync(cancellationToken);
Contains translates to a SQL IN clause with one parameter per element.
That works fine with 50 IDs. It breaks with 50,000, because every database puts a ceiling on how many parameters a single statement can take:
- Oracle: 1,000 expressions in an
INlist - SQL Server: 2,100 parameters per statement
- PostgreSQL and MySQL: much higher (around 64K), but the query planner slows down long before you reach the limit
The failure is nasty because it depends on data volume. The code works in development and tests, but fails in production when someone imports a large batch of orders.
The simplest fix is to batch the IDs and combine the results:
csharpconst int batchSize = 500; var results = new List<Shipment>(); foreach (var batch in orderIds.Chunk(batchSize)) { var chunk = await dbContext.Shipments .AsNoTracking() .Where(s => batch.Contains(s.OrderId)) .ToListAsync(cancellationToken); results.AddRange(chunk); }
For genuinely large ID sets, a better approach is to get the IDs into the database as a table and join against them, using a temporary table or a table-valued parameter.
A join against a table scales in a way that an IN list never will.
I wrote about the library approaches to this problem in EF Core Bulk Data Retrieval: 5 Methods You Should Know.
Stop Repeating the Same Work
At this point, your queries fetch the right data efficiently. The remaining wins come from not doing the same work over and over.
9. Cache the Query Translation with Compiled Queries
Every time you execute a LINQ query, EF Core has to translate the expression tree into SQL.
EF Core caches this translation internally, so it's cheap after the first call. But on a hot path that runs thousands of times per second, even the cache lookup shows up in a profile.
A compiled query does the translation once, at startup:
csharpprivate static readonly Func<ShipmentsDbContext, string, Task<Shipment?>> GetByNumber = EF.CompileAsyncQuery((ShipmentsDbContext context, string number) => context.Shipments .AsNoTracking() .FirstOrDefault(s => s.Number == number)); public Task<Shipment?> GetShipmentAsync(string number) => GetByNumber(dbContext, number);
The delegate is static, so the translation is reused for the lifetime of the application.
Be honest about where this belongs. Compiled queries only pay off on queries you call very often with the same shape, and they can't be composed dynamically the way a normal IQueryable can.
I reach for them on a handful of hot lookups, not across the codebase.
10. Cache the Result
Caching is the last step.
Once a query is genuinely as fast as it can be and you're still running it more often than the data changes, caching the result is the right call.
In .NET 9 and later, HybridCache handles this well:
csharppublic async Task<ShipmentResponse?> GetAsync(string number, CancellationToken ct) { return await hybridCache.GetOrCreateAsync( $"shipment:{number}", async token => await dbContext.Shipments .AsNoTracking() .Where(s => s.Number == number) .Select(s => new ShipmentResponse( s.Id, s.Number, s.Carrier, s.Status, s.CreatedAt)) .FirstOrDefaultAsync(token), cancellationToken: ct); }
HybridCache combines an in-memory cache with a distributed cache like Redis to solve cache stampede.
When 100 requests ask for the same missing key at once, only one hits the database, and the rest wait for that result.
Invalidation is the hard part of caching. Cache data whose staleness you can live with, and be deliberate about evicting entries when the underlying rows change.
Optimize Your Writes
I've seen just as many production incidents caused by writes as by slow reads.
11. Never Call SaveChanges in a Loop
This pattern is common and very expensive (young developers and also AI sometimes make this mistake):
csharpforeach (var shipment in shipments) { shipment.Status = ShipmentStatus.Dispatched; await dbContext.SaveChangesAsync(cancellationToken); }
Each SaveChangesAsync opens a transaction, sends a statement, and waits for the database.
For 1,000 shipments, that's 1,000 round-trips, and network latency dominates everything else.
Move the call outside the loop:
csharpforeach (var shipment in shipments) { shipment.Status = ShipmentStatus.Dispatched; } await dbContext.SaveChangesAsync(cancellationToken);
Now EF Core batches the updates into a small number of statements inside a single transaction. You also get correct behavior for free because either all shipments are dispatched or none are.
This works great if you have a few hundred up to 1,000 rows to insert (or update).
When it comes to thousands or tens of thousands of rows, you need a faster and more robust approach.
For inserting tens of thousands of rows, EF Core isn't the right tool even with batching, as it becomes pretty slow. That's where you need a dedicated bulk library. I recommend using EF Core extensions for bulk write operations.
12. Use ExecuteUpdate and ExecuteDelete for Set-Based Writes
When you need to update or delete data, you often load every entity into memory and then update it.
EF Core tracks the entities and compares snapshots to generate UPDATE or DELETE SQL statements when you call SaveChanges.
When you're applying the same change to many rows, you don't need any of that:
csharpawait dbContext.Shipments .Where(s => s.Status == ShipmentStatus.Processing && s.CreatedAt < cutoff) .ExecuteUpdateAsync(setters => setters .SetProperty(s => s.Status, ShipmentStatus.Cancelled) .SetProperty(s => s.UpdatedAt, DateTime.UtcNow), cancellationToken);
This sends a single UPDATE ... WHERE statement. No rows are loaded, no entities are materialized, and no change tracking happens.
ExecuteDeleteAsync works the same way for deletes.
There are a few caveats:
- These methods bypass the change tracker, so entities already loaded in your
DbContextwill hold stale values. - They also skip
SaveChangesinterceptors, which means audit trails and domain events wired intoSaveChangeswon't fire.
Use them for maintenance and bulk state transitions, and keep business-rule writes on SaveChanges.
I covered the details and the gotchas in The Correct Way to Use ExecuteUpdate and ExecuteDelete Methods in EF Core.
13. Manage DbContext Lifetime
DbContext is designed to be short-lived. It's cheap to create, it isn't thread-safe, and it holds on to every entity it has tracked until it's disposed.
Registering it as scoped is suitable for most web applications, because the scope matches the request.
Background services and parallel work are where this breaks.
A DbContext resolved once and reused across a long-running loop accumulates tracked entities and never releases them, which looks exactly like a memory leak.
Use a factory when you need to control the lifetime yourself:
csharpbuilder.Services.AddDbContextFactory<ShipmentsDbContext>(options => options.UseNpgsql(connectionString)); // In a background service await using var context = await dbContextFactory.CreateDbContextAsync(ct); var pending = await context.Shipments .AsNoTracking() .Where(s => s.Status == ShipmentStatus.Created) .ToListAsync(ct);
Each iteration gets a fresh context that's disposed when it goes out of scope.
For high-throughput services, AddDbContextPool reuses context instances instead of allocating new ones, resetting their state between uses.
It's a real saving on hot paths, though it doesn't support injecting per-request state into your DbContext's constructor.
Summary
All 13 optimizations are a lot to keep in your head when an endpoint is timing out and someone is asking for a quick fix.
Here's how they compare:
| Optimization | Typical impact | When it applies | Effort |
|---|---|---|---|
| Add indexes | Very high | Filtering or sorting on unindexed columns | Low |
| Filter early | Very high | Any client-side Where after ToList | Low |
| Projections | Very high | Returning entities instead of DTOs | Low |
| AsNoTracking | Medium | Read-only queries returning entities | Very low |
| Eager loading | High | Include chains, or lazy loading enabled | Medium |
| AsSplitQuery | Varies | Two or more collection includes | Very low |
| Keyset pagination | High at depth | Large tables with deep pages | Medium |
Batch large IN lists | Prevents failure | Filtering by thousands of ids | Medium |
| Compiled queries | Low | Very hot, fixed-shape queries | Medium |
| Caching | Very high | Data read far more often than it changes | High |
Batch SaveChanges | Very high | Saving inside a loop | Very low |
ExecuteUpdate | High | Same change across many rows | Low |
| DbContext lifetime | Prevents leaks | Background and parallel work | Low |
The order I work through them is always the same.
Step 1:
I start by measuring because guessing takes more time than measuring.
Step 2:
Then I fix what the query fetches: indexes, filters, and projections, in that order.
Those three account for most of the wins in every codebase I've worked on, and they're the cheapest changes to make.
Step 3:
Only then do I look at how the data is loaded, with tracking behavior and include strategy.
Step 4:
Pagination and parameter limits come next, because they're about how the query behaves as the table grows rather than how it behaves today.
Step 5:
Compiled queries and caching come last.
Both add complexity, and both are much less useful once the first three steps have done their job.
Caching an unoptimized query only reduces how often you pay its cost.
Hope you find this newsletter useful. See you next time.
Comments